"clr!JIT_DbgIsJustMyCode" 호출이 뭘까요?
(미리 말하면, 이 글은 매우 쓸데없는 분석이므로 흥미가 없다면 뒤로 가기를 하면 됩니다. ^^)
닷넷 디버깅을 assembly 레벨로 하다 보면 종종 보게 되는 것이 clr!JIT_DbgIsJustMyCode 함수에 대한 호출입니다.
C:\temp\ConsoleApp1\Program.cs @ 25:
00e10af8 55              push    ebp
00e10af9 8bec            mov     ebp,esp
00e10afb 57              push    edi
00e10afc 56              push    esi
00e10afd 83ec24          sub     esp,24h
00e10b00 8bf1            mov     esi,ecx
00e10b02 8d7dd4          lea     edi,[ebp-2Ch]
00e10b05 b907000000      mov     ecx,7
00e10b0a 33c0            xor     eax,eax
00e10b0c f3ab            rep stos dword ptr es:[edi]
00e10b0e 8bce            mov     ecx,esi
00e10b10 894df4          mov     dword ptr [ebp-0Ch],ecx
00e10b13 8955f0          mov     dword ptr [ebp-10h],edx
00e10b16 833df042d30000  cmp     dword ptr ds:[0D342F0h],0
00e10b1d 7405            je      00e10b24
00e10b1f e85cf24c71      call    clr!JIT_DbgIsJustMyCode (722dfd80)
00e10b24 8b055423ab03    mov     eax,dword ptr ds:[3AB2354h] ("callback: {0}, {1}, {2}, {3}, {4}")
00e10b2a 8945ec          mov     dword ptr [ebp-14h],eax
위의 코드에서 보면 0D342F0h 주소의 int 값이 0이 아니면 JIT_DbgIsJustMyCode 함수를 호출하게 되어 있습니다. 테스트를 해보면, 디버그 빌드한 응용 프로그램을 실행하거나, 릴리스 빌드여도 비주얼 스튜디오에서 F5 디버깅을 시작하면 꼭 저런 식으로 JIT_DbgIsJustMyCode 호출 코드가 모든 닷넷 메서드에 포함됩니다.
그런데, 도대체 이게 뭐 하는 걸까요? 또한 0D342F0h 주소의 값이 어떤 경우에 0이 아닌 값으로 설정이 되는 걸까요? 우선 coreclr 소스 코드에 이 함수의 정의를 찾아볼 수 있습니다.
// https://github.com/dotnet/runtime/blob/master/src/coreclr/src/vm/jithelpers.cpp

/*********************************************************************/
// Callback for Just-My-Code probe
// Probe looks like:
//  if (*pFlag != 0) call JIT_DbgIsJustMyCode
// So this is only called if the flag (obtained by GetJMCFlagAddr) is
// non-zero.
HCIMPL0(void, JIT_DbgIsJustMyCode)
{
    FCALL_CONTRACT;

    // We need to get both the ip of the managed function this probe is in
    // (which will be our return address) and the frame pointer for that
    // function (since we can't get it later because we're pushing unmanaged
    // frames on the stack).
    void * ip = NULL;

    // <NOTE>
    // In order for the return address to be correct, we must NOT call any
    // function before calling _ReturnAddress().
    // </NOTE>
    ip = _ReturnAddress();

    _ASSERTE(ip != NULL);
}
    // Call into debugger proper
    g_pDebugInterface->OnMethodEnter(ip);

    return;
}
HCIMPLEND
다른 거 없이 그냥 g_pDebugInterface->OnMethodEnter 함수로 호출을 대행합니다. 마찬가지로 이와 관련된 소스 코드를 찾아들어가 보면,
// https://github.com/dotnet/runtime/blob/master/src/coreclr/src/vm/dbginterface.h

    // For Just-My-Code (aka Just-User-Code).
    // The jit inserts probes that look like.
    // if (*pAddr != 0) call g_pDebugInterface->OnMethodEnter()

    // Invoked when we enter a user method.
    // pIP is an ip within the method, right after the prolog.
    virtual void OnMethodEnter(void * pIP) = 0;
DebugInterface 클래스에 추상 메서드로 정의되어 있고,
// https://github.com/dotnet/runtime/blob/master/src/coreclr/src/debug/ee/debugger.h

    // For Just-My-Code (aka Just-User-Code).
    // The jit injects probes in debuggable managed methods that look like:
    // if (*pFlag != 0) call JIT_DbgIsJustMyCode.
    // pFlag is unique per-method constant determined by GetJMCFlagAddr.
    // JIT_DbgIsJustMyCode will get the ip & fp and call OnMethodEnter.

    // pIP is an ip within the method, right after the prolog.
#ifndef DACCESS_COMPILE
    virtual void OnMethodEnter(void * pIP);
    virtual DWORD* GetJMCFlagAddr(Module * pModule);
#endif
구현은, CORDebugger(예를 들어, Visual Studio)가 디버깅 중이면 DebuggerController::DispatchMethodEnter를 호출하고 있습니다.
// https://github.com/dotnet/runtime/blob/master/src/coreclr/src/debug/ee/debugger.cpp

/******************************************************************************
 * For Just-My-Code (aka Just-User-Code).
 * Invoked from a probe in managed code when we enter a user method and
 * the flag (set by GetJMCFlagAddr) for that method is != 0.
 * pIP - the ip within the method, right after the prolog.
 * sp  - stack pointer (frame pointer on x86) for the managed method we're entering.
 * bsp - backing store pointer for the managed method we're entering
  ******************************************************************************/
void Debugger::OnMethodEnter(void * pIP)
{
    // ...[생략]...

    if (!CORDebuggerAttached())
    {
        LOG((LF_CORDB, LL_INFO1000000, "D::OnMethodEnter returning since debugger attached.\n"));
        return;
    }
    FramePointer fp = LEAF_MOST_FRAME;
    DebuggerController::DispatchMethodEnter(pIP, fp);
}
이어서 DispatchMethodEnter 함수는, 다시 그 책임을 TriggerMethodEnter로 넘깁니다.
// https://github.com/dotnet/runtime/blob/master/src/coreclr/src/debug/ee/controller.cpp

// Loop through controllers and dispatch TriggerMethodEnter
void DebuggerController::DispatchMethodEnter(void * pIP, FramePointer fp)
{
    _ASSERTE(pIP != NULL);

    Thread * pThread = g_pEEInterface->GetThread();
    _ASSERTE(pThread  != NULL);

    // Lookup the DJI for this method & ip.
    // Since we create DJIs when we jit the code, and this code has been jitted
    // (that's where the probe's coming from!), we will have a DJI.
    DebuggerJitInfo * dji = g_pDebugger->GetJitInfoFromAddr((TADDR) pIP);

    // This includes the case where we have a LightWeight codegen method.
    if (dji == NULL)
    {
        return;
    }

    // ...[생략]...

    ControllerLockHolder lockController;

    // For debug check, keep a count to make sure that g_cTotalMethodEnter
    // is actually the number of controllers w/ MethodEnter enabled.
    int count = 0;

    DebuggerController *p = g_controllers;
    while (p != NULL)
    {
        if (p->m_fEnableMethodEnter)
        {
            if ((p->GetThread() == NULL) || (p->GetThread() == pThread))
            {
                ++count;
                p->TriggerMethodEnter(pThread, dji, (const BYTE *) pIP, fp);
            }
        }
        p = p->m_next;
    }

    _ASSERTE(g_cTotalMethodEnter == count);
}
등록된 TriggerMethodEnter는 총 3개인데,
// https://github.com/dotnet/runtime/blob/master/src/coreclr/src/debug/ee/controller.cpp

void DebuggerController::TriggerMethodEnter(Thread * thread,
                                            DebuggerJitInfo * dji,
                                            const BYTE * ip,
                                            FramePointer fp)
{
    LOG((LF_CORDB, LL_INFO10000, "DC::TME in default impl. dji=%p, addr=%p, fp=%p\n",
        dji, ip, fp.GetSPValue()));
}
// https://github.com/dotnet/runtime/blob/master/src/coreclr/src/debug/ee/controller.cpp

// Traditional steppers enable MethodEnter as a back-stop for step-in.
// We hope that the stub-managers will predict the step-in for us,
// but in case they don't the Method-Enter should catch us.
// MethodEnter is not fully correct for traditional steppers for a few reasons:
// - doesn't handle step-in to native
// - stops us *after* the prolog (a traditional stepper can stop us before the prolog).
// - only works for methods that have the JMC probe. That can exclude all optimized code.
void DebuggerStepper::TriggerMethodEnter(Thread * thread,
                                            DebuggerJitInfo *dji,
                                            const BYTE * ip,
                                            FramePointer fp)
{
    // ...[생략]...

    MethodDesc * pDesc = dji->m_nativeCodeVersion.GetMethodDesc();
    LOG((LF_CORDB, LL_INFO10000, "DJMCStepper::TME, desc=%p, addr=%p\n",
        pDesc, ip));

    // JMC steppers won't stop in Lightweight delegates. Just return & keep executing.
    if (pDesc->IsNoMetadata())
    {
        LOG((LF_CORDB, LL_INFO100000, "DJMCStepper::TME, skipping b/c it's lw-codegen\n"));
        return;
    }

    // This is really just a heuristic.  We don't want to trigger a JMC probe when we are
    // executing in an IL stub, or in one of the marshaling methods called by the IL stub.
    // The problem is that the IL stub can call into arbitrary code, including custom marshalers.
    // In that case the user has to put a breakpoint to stop in the code.
    if (g_pEEInterface->DetectHandleILStubs(thread))
    {
        return;
    }

    // ...[생략]...

    // Place a patch to stopus.
    // Don't bind to a particular AppDomain so that we can do a Cross-Appdomain step.
    AddBindAndActivateNativeManagedPatch(pDesc,
                  dji,
                  CodeRegionInfo::GetCodeRegionInfo(dji, pDesc).AddressToOffset(ip),
                  fp,
                  NULL // AppDomain
    );

    LOG((LF_CORDB, LL_INFO10000, "DJMCStepper::TME, after setting patch to stop\n"));

    // Once we resume, we'll go hit that patch (duh, we patched our return address)
    // Furthermore, we know the step will complete with reason = call, so set that now.
    m_reason = STEP_CALL;
}
// https://github.com/dotnet/runtime/blob/master/src/coreclr/src/debug/ee/controller.cpp

// Dispatched right after the prolog of a JMC function.
// We may be blocking the GC here, so let's be fast!
void DebuggerJMCStepper::TriggerMethodEnter(Thread * thread,
                                            DebuggerJitInfo *dji,
                                            const BYTE * ip,
                                            FramePointer fp)
{
    // ...[생략]...

    MethodDesc * pDesc = dji->m_nativeCodeVersion.GetMethodDesc();
    LOG((LF_CORDB, LL_INFO10000, "DJMCStepper::TME, desc=%p, addr=%p\n",
        pDesc, ip));

    // JMC steppers won't stop in Lightweight delegates. Just return & keep executing.
    if (pDesc->IsNoMetadata())
    {
        LOG((LF_CORDB, LL_INFO100000, "DJMCStepper::TME, skipping b/c it's lw-codegen\n"));
        return;
    }

    // Is this user code?
    DebuggerMethodInfo * dmi = dji->m_methodInfo;
    bool fIsUserCode = dmi->IsJMCFunction();

    LOG((LF_CORDB, LL_INFO100000, "DJMCStepper::TME, '%s::%s' is '%s' code\n",
        pDesc->m_pszDebugClassName,
        pDesc->m_pszDebugMethodName,
        fIsUserCode ? "user" : "non-user"
    ));

    // If this isn't user code, then just return and continue executing.
    if (!fIsUserCode)
        return;

    // MethodEnter is only enabled when we want to stop in a JMC function.
    // And that's where we are now. So patch the ip and resume.
    // The stepper will hit the patch, and stop.

    // It's a good thing we have the fp passed in, because we have no other
    // way of getting it. We can't do a stack trace here (the stack trace
    // would start at the last pushed Frame, which miss a lot of managed
    // frames).

    // Don't bind to a particular AppDomain so that we can do a Cross-Appdomain step.
    AddBindAndActivateNativeManagedPatch(pDesc,
                  dji,
                  CodeRegionInfo::GetCodeRegionInfo(dji, pDesc).AddressToOffset(ip),
                  fp,
                  NULL // AppDomain
    );

    LOG((LF_CORDB, LL_INFO10000, "DJMCStepper::TME, after setting patch to stop\n"));

    // Once we resume, we'll go hit that patch (duh, we patched our return address)
    // Furthermore, we know the step will complete with reason = call, so set that now.
    m_reason = STEP_CALL;
}
봐도 잘 모르겠습니다. ^^; 그 와중에 주석문을 대충 파악해 보면 Debugger가 Step-into로 해당 메서드를 진입할 때 정확히 닷넷 메서드의 prologue 영역을 지나 사용자 코드의 시작 부분에서 디버거로 하여금 멈추게 하는 역할을 하는 것으로 보입니다. 그러니까, 비주얼 스튜디오에서 디버깅하는 경우, Step-into로 해당 메서드를 진입하려고 시도하는 순간에만 잠시 JIT_DbgIsJustMyCode를 실행하기 위해 0D342F0h 주솟값이 0이 아닌 값으로 설정되는 듯합니다.
C:\temp\ConsoleApp1\Program.cs @ 25:
00e10af8 55              push    ebp
...[생략]...
00e10b16 833df042d30000  cmp     dword ptr ds:[0D342F0h],0
00e10b1d 7405            je      00e10b24
00e10b1f e85cf24c71      call    clr!JIT_DbgIsJustMyCode (722dfd80)
00e10b24 8b055423ab03    mov     eax,dword ptr ds:[3AB2354h] ("callback: {0}, {1}, {2}, {3}, {4}")
00e10b2a 8945ec          mov     dword ptr [ebp-14h],eax
가정을 증명하기 위해 테스트를 해야 할 텐데요, 간단하게 다음과 같이 코딩을 하고,
using System;
using System.Collections.Generic;

class Program
{
    static void Main(string[] args)
    {
        CallMyMethod();
        Console.ReadLine();
        CallMyMethod();
    }

    static void CallMyMethod()
    {
        Console.WriteLine("CallMyMethod");
    }
}
첫 번째 CallMyMethod 호출에서 JIT 컴파일이 되도록 한 다음, 두 번째 CallMyMethod 호출 전에 Disassembly 창을 이용해 CallMyMethod 내에 심어진 JIT_DbgIsJustMyCode 호출 주소를 알아낸 다음(그림에서는 0x2710f3a),
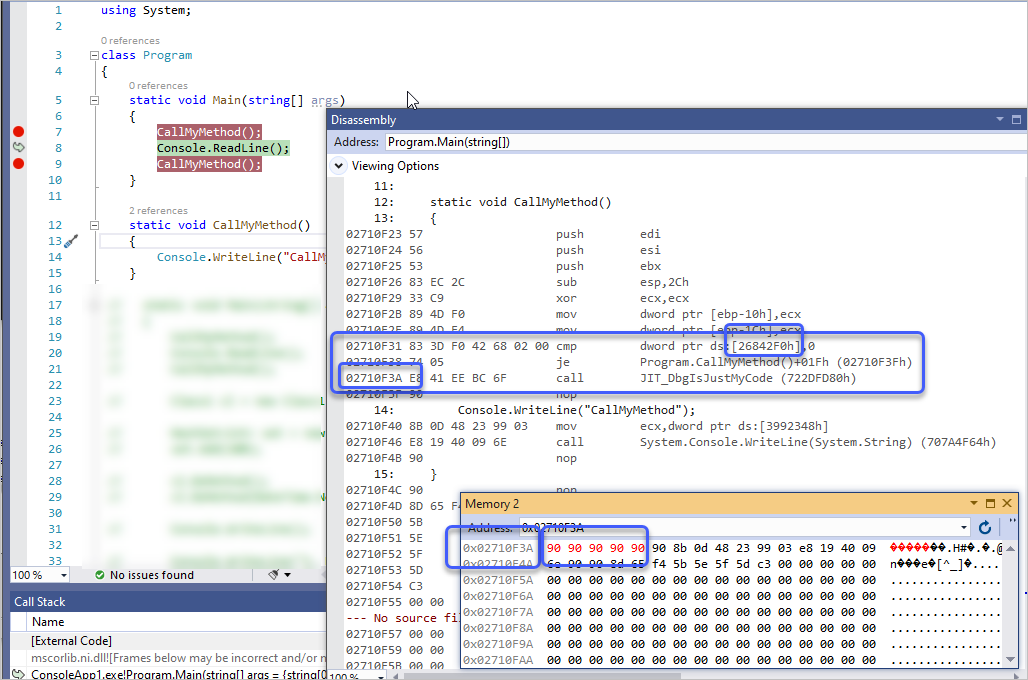
동작을 하지 못하도록 메모리 창을 이용해 5바이트만큼 nop 코드로 패치했습니다.
90 90 90 90 90
그런 다음, 두 번째 호출 시 F11(Step-into) 디버깅으로 진입했는데... 잘 됩니다. ^^; 음... 이러면 안 되는데요.
혹시 호출되기는 하는 걸까요? 그래서 이번에는 int 3 인터럽트가 발생하도록 이렇게 5바이트 패치를 했습니다.
cc 90 90 90 90
그런 후 다시 Step-into 진입을 시도하면 Output 창에 다음의 오류 메시지가 뜨지만,
The process hit a breakpoint the Common Language Runtime cannot continue from.
This may be caused by an embedded breakpoint in the native runtime or a breakpoint set in a can't-stop region.
To investigate further, use native-only debugging.
따라서, 적어도 JIT_DbgIsJustMyCode를 호출하기 위한 "0D342F0h" 등의 주솟값은 0 아닌 값으로 설정은 되었다는 것입니다. (게다가, 저렇게 int 3오류에도 불구하고 디버거는 CallMyMethod 내로 진입을 합니다.)
일단, 그래도 Step-into에 의해 실행은 된다는 것이므로 희망은 보입니다. 그렇게 보면, 비주얼 스튜디오가 JIT_DbgIsJustMyCode의 도움 없이도 Step-into 코드를 잘 실행하는 것 같습니다.
그래도... 아무리 생각해도 JIT_DbgIsJustMyCode 코드의 구현은 step-into에 의해 사용자 코드에 해당하는 메서드인 경우 bp 역할을 하는 것처럼 보이는데... 왜 테스트가 안 되는 걸까요? 그래서 이번에는 다소 복잡하게 사용자 코드가 아닌 환경을 경유해서 디버깅하는 것으로 변경해 봤습니다.
using System;
using System.Diagnostics;

class Program
{
    static void Main(string[] args)
    {
        Program pg = new Program();
        pg.DoMethod(); // step-into 테스트
        pg.DoMethod(); // step-into 테스트
    }

    [DebuggerNonUserCode]
    private void DoMethod(Action action)
    {
        Console.WriteLine("DoMethod");
        CallMyMethod();
    }

    static void CallMyMethod()
    {
        Console.WriteLine("CallMyMethod");
    }
}
2개의 DoMethod 호출에 BP를 걸고, 첫 번째 BP에서 step-into로 CallMyMethod에 진입한 것을 확인한 다음, 두 번째 BP까지 실행을 진행하고 역시 마찬가지로 CallMyMethod의 JIT_DbgIsJustMyCode 호출 부분을 "90 90 90 90 90"으로 패치합니다.
이후, 두 번째 BP에서 step-into로 들어가면... ^^ 이번에는 CallMyMethod 내에 진입을 못하고 디버거가 실행을 지나가 버립니다. 이제서야 테스트가 되었습니다. ^^ 그러니까, JIT_DbgIsJustMyCode는 복잡한 호출 관계에서 "My Code"에서만 step-into 실행이 멈추도록 도와주는 함수였던 것입니다.
정리해 보면, JIT_DbgIsJustMyCode는 Debug 빌드 또는 비주얼 스튜디오에 의해 디버깅(F5)을 하는 프로세스인 경우 JIT 컴파일 시점에 자동으로 코드 삽입이 됩니다. 하지만, 그것의 실행을 제어하는 값이 설정되어 있지 않다면 실행되지 않으므로 각각의 메서드 크기가 14 바이트(cmp, je, call)만큼 조금 커진다는 것과 cmp 비교가 언제나 실행된다는 정도의 오버헤드가 있습니다.
[이 글에 대해서 여러분들과 의견을 공유하고 싶습니다. 틀리거나 미흡한 부분 또는 의문 사항이 있으시면 언제든 댓글 남겨주십시오.]