Logstash 기본 사용법
이에 대한 공식 문서는 있지만,
Getting Started with Logstash
; http://elastic.co/guide/en/logstash/current/getting-started-with-logstash.html
그래도 다음의 동영상을 먼저 보실 것을 권장합니다. ^^
Logstash 시작하기 (약 43분 동영상)
; https://www.elastic.co/kr/webinars/getting-started-logstash?baymax=rtp&elektra=docs&storm=top-video&iesrc=ctr
이 글은 사실 저 동영상을 정리한 것에 불과합니다.
동영상에 보면, Logstash가 어떤 위치를 차지하는지 보여주는 다이어그램이 하나 나옵니다.
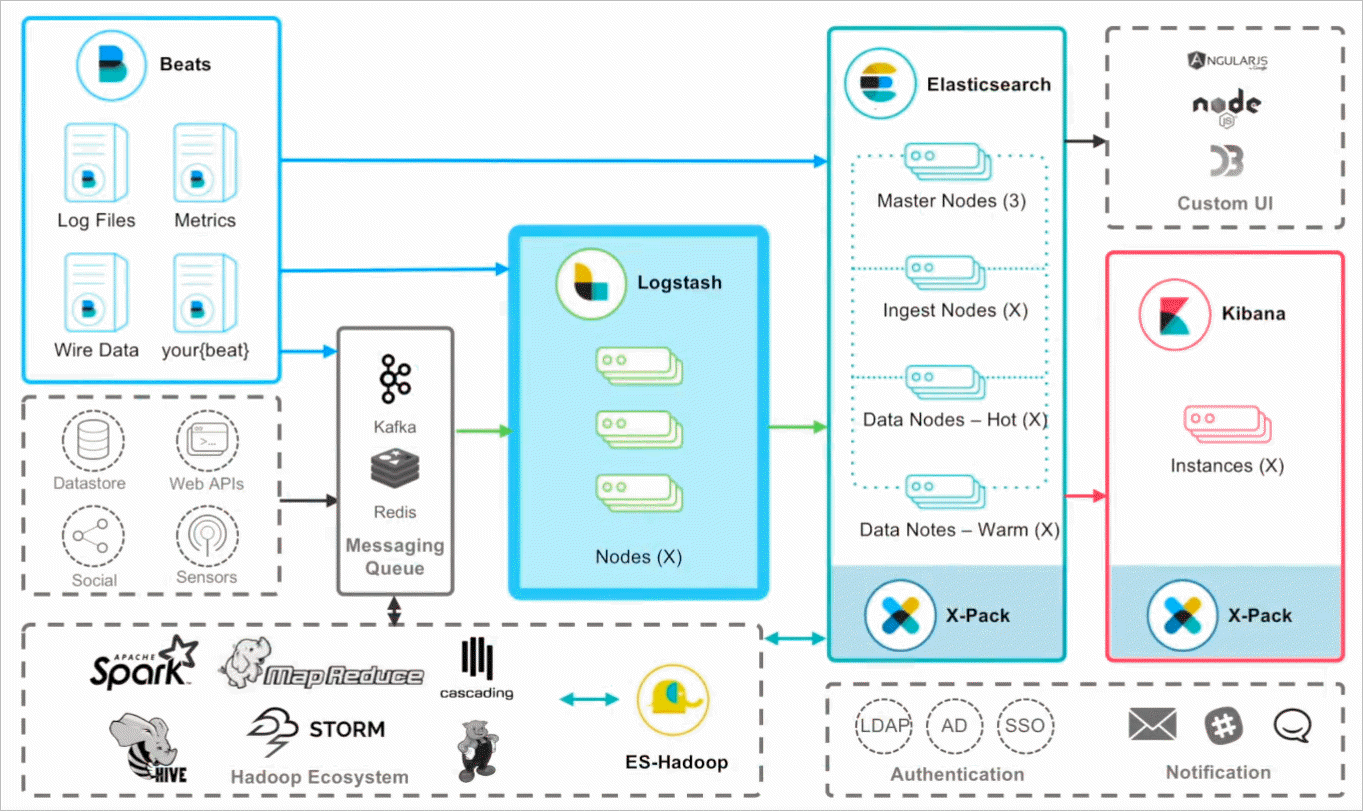
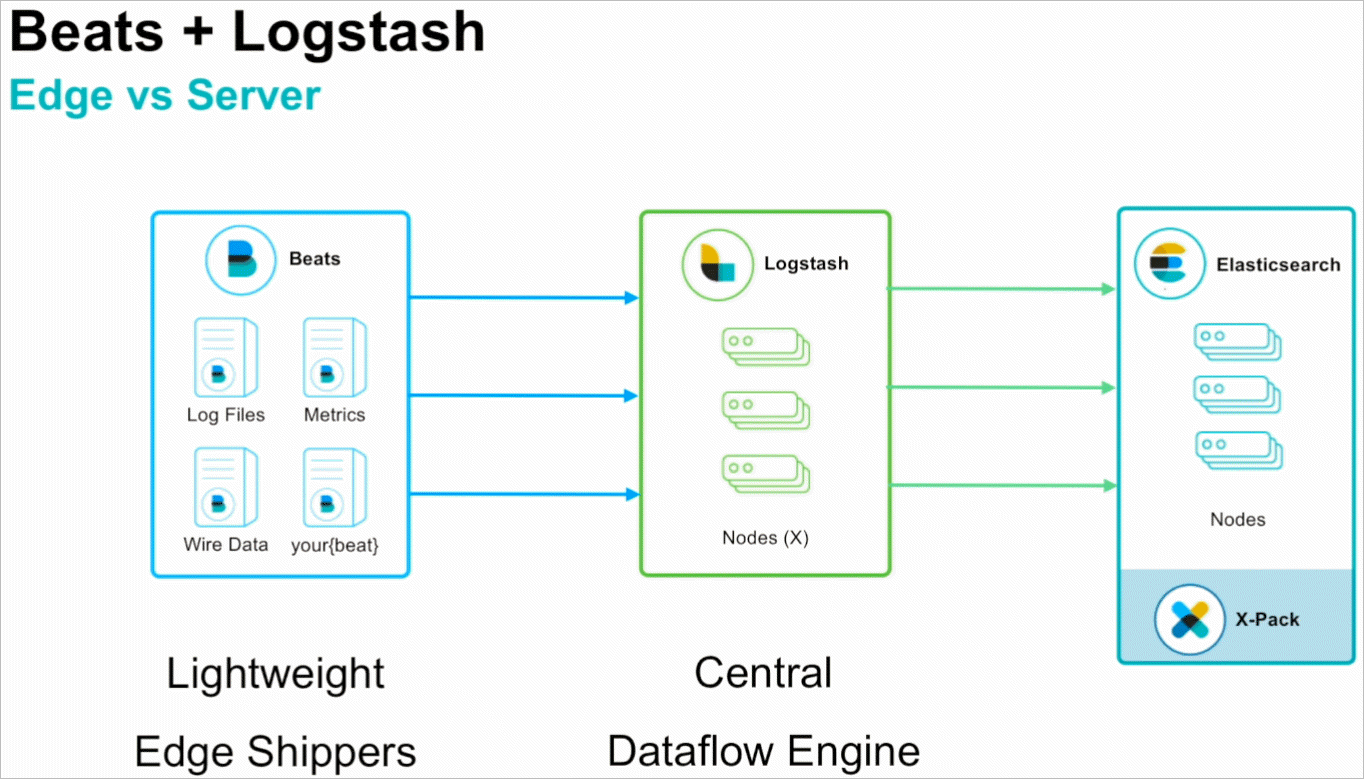
즉, Logstash 스스로 elasticsearch에 데이터를 보낼 수도 있고, 아니면 Beats로부터 온 데이터를 수집/가공 후 전달할 수도 있습니다. 예전 글을 검색하다 보면 Logstash만으로 구성하는 것을 볼 수 있는데, 그 자체로는 다소 무겁다 보니 순수 로그 수집 역할만 하는 경량화된 Beats가 나오면서 Logstash는 아래의 이미지에서처럼 일종의 Dataflow 엔진으로써의 서버 역할을 수행하는 것으로 바뀌는 분위기입니다.
하지만, 이번 글에서는 Beats까지는 설명하지 않을 것이고 Logstash의 Input/Filter/Output의 개념을 잡는 것만 다룰 것입니다.
저처럼 성격이 급하면 ^^ 우선 .\bin\logstash.bat 파일을 실행해 볼 텐데요, 그냥 실행하는 경우 다음과 같이 "ERROR: Pipelines YAML file is empty" 오류가 발생합니다.
c:\temp> logstash.bat
Java HotSpot(TM) 64-Bit Server VM warning: Option UseConcMarkSweepGC was deprecated in version 9.0 and will likely be removed in a future release.
WARNING: An illegal reflective access operation has occurred
WARNING: Illegal reflective access by org.jruby.ext.openssl.SecurityHelper (file:/C:/Users/tstusr/AppData/Local/Temp/jruby-6388/jruby10138242635010762776jopenssl.jar) to field java.security.MessageDigest.provider
WARNING: Please consider reporting this to the maintainers of org.jruby.ext.openssl.SecurityHelper
WARNING: Use --illegal-access=warn to enable warnings of further illegal reflective access operations
WARNING: All illegal access operations will be denied in a future release
Sending Logstash logs to C:/logstash/logs which is now configured via log4j2.properties
[2020-09-04T11:07:44,103][INFO ][logstash.runner          ] Starting Logstash {"logstash.version"=>"7.9.0", "jruby.version"=>"jruby 9.2.12.0 (2.5.7) 2020-07-01 db01a49ba6 Java HotSpot(TM) 64-Bit Server VM 11.0.8+10-LTS on 11.0.8+10-LTS +indy +jit [mswin32-x86_64]"}
ERROR: Pipelines YAML file is empty. Location: C:/logstash/config/pipelines.yml
usage:
  bin/logstash -f CONFIG_PATH [-t] [-r] [] [-w COUNT] [-l LOG]
  bin/logstash --modules MODULE_NAME [-M "MODULE_NAME.var.PLUGIN_TYPE.PLUGIN_NAME.VARIABLE_NAME=VALUE"] [-t] [-w COUNT] [-l LOG]
  bin/logstash -e CONFIG_STR [-t] [--log.level fatal|error|warn|info|debug|trace] [-w COUNT] [-l LOG]
  bin/logstash -i SHELL [--log.level fatal|error|warn|info|debug|trace]
  bin/logstash -V [--log.level fatal|error|warn|info|debug|trace]
  bin/logstash --help
[2020-09-04T11:07:44,404][ERROR][org.logstash.Logstash    ] java.lang.IllegalStateException: Logstash stopped processing because of an error: (SystemExit) exit
메시지에 따라 "C:/logstash/config/pipelines.yml" 파일이 존재하지만 그 안에는 파이프라인 처리가 하나도 명시되어 있지 않기 때문에 발생하는 오류입니다. Logstash의 파이프라인은,

크게 Input, Filter, Output으로 나뉘며 Input 및 Output에는 데이터 역직렬화/직렬화를 위한 Codec을 연결하는 구조입니다.
Input
    - Files
    - Syslog
    - SQL Queries
    - HTTP requests
    - Elasticsearch
    - Beats
    - Metrics systems
    - And more!

Filter
    - log 파싱
    - 데이터 확장
    - 태그 추가
    - And more!

Output
    - Elasticsearch
    - Data 보관소 (예: Amazon S3)
    - Alerting & Monitoring 시스템
    - And more!

Codec: 데이터 인코딩 & 디코딩
    - JSON
    - Avro
    - msgpack
    - Netflow
    - CloudTrail
    - And more!
내부적으로 이들이 동작하는 방식은 다음의 그림으로 정리가 됩니다.
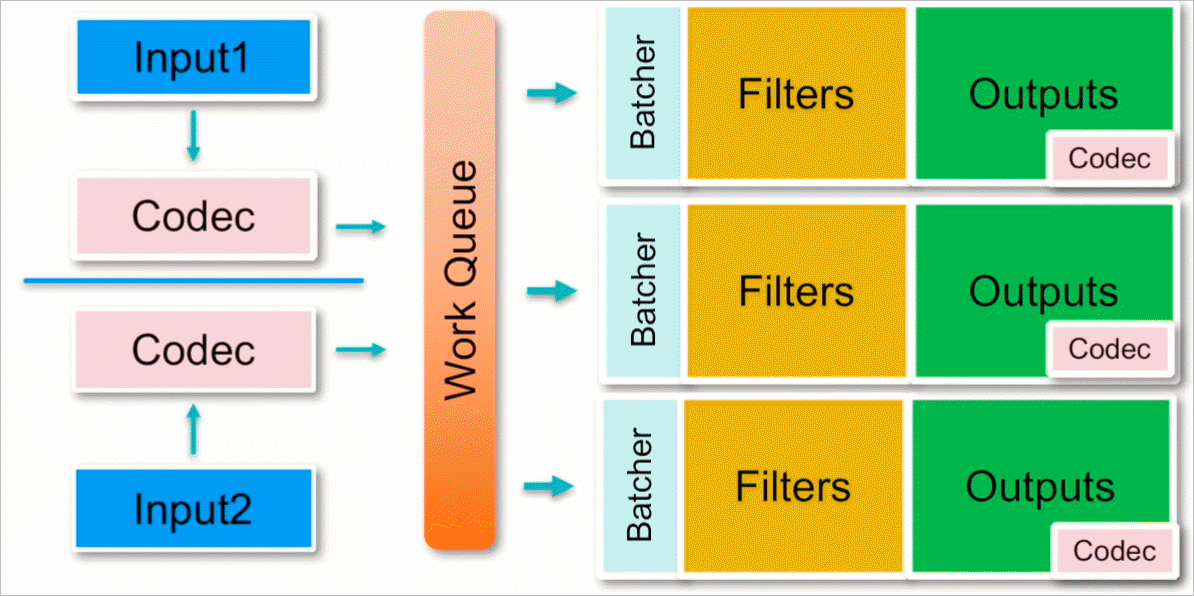
물론, 설정에 따라 work queue의 크기 조정이나, Batcher에서 얼마만큼의 벌크 단위로 Output으로 보낼지 등의 설정을 yml의 옵션 변경으로 할 수 있다고 합니다.
자, 그럼 대충 구조를 보니 파이프라인을 설정해야 한다는 것은 알겠고, logstash는 이러한 파이프라인 설정을 명령행에서 할 수 있도록 "-e" 옵션을 제공하므로 Filter 없이 기본적인 Input/Output을 콘솔을 대상으로 수행하도록 다음과 같이 logstash를 수행할 수 있습니다.
C:\logstash> .\bin\logstash.bat -e "input { stdin { } } output { stdout { } }"
Java HotSpot(TM) 64-Bit Server VM warning: Option UseConcMarkSweepGC was deprecated in version 9.0 and will likely be removed in a future release.
WARNING: An illegal reflective access operation has occurred
WARNING: Illegal reflective access by org.jruby.ext.openssl.SecurityHelper (file:/C:/Users/tstusr/AppData/Local/Temp/jruby-1684/jruby6939663397342853683jopenssl.jar) to field java.security.MessageDigest.provider
WARNING: Please consider reporting this to the maintainers of org.jruby.ext.openssl.SecurityHelper
WARNING: Use --illegal-access=warn to enable warnings of further illegal reflective access operations
WARNING: All illegal access operations will be denied in a future release
Sending Logstash logs to C:/logstash/logs which is now configured via log4j2.properties
[2020-09-04T14:20:45,142][INFO ][logstash.runner          ] Starting Logstash {"logstash.version"=>"7.9.0", "jruby.version"=>"jruby 9.2.12.0 (2.5.7) 2020-07-01 db01a49ba6 Java HotSpot(TM) 64-Bit Server VM 11.0.8+10-LTS on 11.0.8+10-LTS +indy +jit [mswin32-x86_64]"}
[2020-09-04T14:20:45,387][WARN ][logstash.config.source.multilocal] Ignoring the 'pipelines.yml' file because modules or command line options are specified
[2020-09-04T14:20:46,642][INFO ][org.reflections.Reflections] Reflections took 35 ms to scan 1 urls, producing 22 keys and 45 values
[2020-09-04T14:20:47,347][INFO ][logstash.javapipeline    ][main] Starting pipeline {:pipeline_id=>"main", "pipeline.workers"=>8, "pipeline.batch.size"=>125, "pipeline.batch.delay"=>50, "pipeline.max_inflight"=>1000, "pipeline.sources"=>["config string"], :thread=>"#<Thread:0x394dc001 run>"}
[2020-09-04T14:20:48,106][INFO ][logstash.javapipeline    ][main] Pipeline Java execution initialization time {"seconds"=>0.74}
[2020-09-04T14:20:48,202][INFO ][logstash.javapipeline    ][main] Pipeline started {"pipeline.id"=>"main"}
The stdin plugin is now waiting for input:
[2020-09-04T14:20:48,264][INFO ][logstash.agent           ] Pipelines running {:count=>1, :running_pipelines=>[:main], :non_running_pipelines=>[]}
[2020-09-04T14:20:48,523][INFO ][logstash.agent           ] Successfully started Logstash API endpoint {:port=>9600}
위와 같은 상태에서, 마지막에 커서가 깜박이는 위치에 "Hello World"를 입력하고 엔터를 치면, 다음과 같이 이를 그대로 해석해 Console로 출력하게 됩니다.
Hello world

{
    "@timestamp" => 2020-09-04T05:21:27.198Z,
      "@version" => "1",
       "message" => "Hello world\r",
          "host" => "testpc"
}
사실, 이렇게 "-e" 옵션을 사용해 파이프라인을 적용하는 것은 현업에서 거의 볼 수 없습니다. 왜냐하면 실제적으로 사용하려면 꽤나 복잡해지기 때문에 대개의 경우 파일을 전달하게 되는데요, 예를 들어 sample.conf라는 파일명으로 다음과 같은 내용을 담고 있으면,
input {
    stdin { }
}

output {
    stdout { }
}
이를 "-f" 옵션으로 경로와 함께 전달해 실행하는 식으로 운영하는 것이 더 일반적입니다.
C:\logstash> .\bin\logstash.bat -f .\config\sample.conf
Java HotSpot(TM) 64-Bit Server VM warning: Option UseConcMarkSweepGC was deprecated in version 9.0 and will likely be removed in a future release.
WARNING: An illegal reflective access operation has occurred
WARNING: Illegal reflective access by org.jruby.ext.openssl.SecurityHelper (file:/C:/Users/tstusr/AppData/Local/Temp/jruby-8988/jruby9834988936030215649jopenssl.jar) to field java.security.MessageDigest.provider
WARNING: Please consider reporting this to the maintainers of org.jruby.ext.openssl.SecurityHelper
WARNING: Use --illegal-access=warn to enable warnings of further illegal reflective access operations
WARNING: All illegal access operations will be denied in a future release
Sending Logstash logs to C:/logstash/logs which is now configured via log4j2.properties
[2020-09-04T14:24:03,152][INFO ][logstash.runner          ] Starting Logstash {"logstash.version"=>"7.9.0", "jruby.version"=>"jruby 9.2.12.0 (2.5.7) 2020-07-01 db01a49ba6 Java HotSpot(TM) 64-Bit Server VM 11.0.8+10-LTS on 11.0.8+10-LTS +indy +jit [mswin32-x86_64]"}
[2020-09-04T14:24:03,389][WARN ][logstash.config.source.multilocal] Ignoring the 'pipelines.yml' file because modules or command line options are specified
[2020-09-04T14:24:04,745][INFO ][org.reflections.Reflections] Reflections took 38 ms to scan 1 urls, producing 22 keys and 45 values
[2020-09-04T14:24:05,369][INFO ][logstash.javapipeline    ][main] Starting pipeline {:pipeline_id=>"main", "pipeline.workers"=>8, "pipeline.batch.size"=>125, "pipeline.batch.delay"=>50, "pipeline.max_inflight"=>1000, "pipeline.sources"=>["C:/logstash/config/sample.conf"], :thread=>"#<Thread:0x651b361c run>"}
[2020-09-04T14:24:06,167][INFO ][logstash.javapipeline    ][main] Pipeline Java execution initialization time {"seconds"=>0.77}
[2020-09-04T14:24:06,232][INFO ][logstash.javapipeline    ][main] Pipeline started {"pipeline.id"=>"main"}
The stdin plugin is now waiting for input:
[2020-09-04T14:24:06,293][INFO ][logstash.agent           ] Pipelines running {:count=>1, :running_pipelines=>[:main], :non_running_pipelines=>[]}
[2020-09-04T14:24:06,536][INFO ][logstash.agent           ] Successfully started Logstash API endpoint {:port=>9600}
Hello World
{
    "@timestamp" => 2020-09-04T05:24:15.093Z,
      "@version" => "1",
       "message" => "Hello World\r",
          "host" => "testpc"
}
이것만으로도 대충 개념을 아시겠죠? ^^
짐작할 수 있겠지만, 로그의 내용을 파싱하는 것은 여러 번의 시행착오를 거칠 수 있으므로 conf 파일의 파이프라인 내용은 초기 작업에서 빈번하게 바뀔 수 있는데, 그때마다 파일 변경하고 logstash.bat을 다시 실행하는 방식은 매우 비효율적입니다. 이를 위해 다음의 옵션 2가지를 ./config/logstash.yml 설정 파일에서 변경할 수 있는데,
...[생략]...

# Periodically check if the configuration has changed and reload the pipeline
# This can also be triggered manually through the SIGHUP signal
#
config.reload.automatic: true

#
# How often to check if the pipeline configuration has changed (in seconds)
# Note that the unit value (s) is required. Values without a qualifier (e.g. 60)
# are treated as nanoseconds.
# Setting the interval this way is not recommended and might change in later versions.
#
config.reload.interval: 3s

...[생략]...
이렇게 설정해 주면 3초마다 파이프라인이 지정된 conf 파일이 바뀌면 자동으로 다시 로드하므로 편리하게 테스트/적용할 수 있습니다. 또한, logstash.bat의 "-f" 옵션으로 conf 파일을 전달하는 것도 ./config/pipelines.yml에 "pipeline.id", "path.config"으로 미리 설정할 수 있습니다.
...[생략]...

- pipeline.id: sample_log_io
  path.config: C:\logstash\config\sample.conf

...[생략]...
위와 같이 logstash.yml과 pipelines.yml을 설정한 후 logstash.bat를 실행시키면, 이제부터는 sample.conf 파일의 내용을 바꿔가며 저장하면서 결과를 바로바로 확인할 수 있습니다.
테스트하기 좋게 설정을 완료했으니, 이제 파이프라인을 약간 변형시켜 볼까요? ^^
input {
  tcp {
    port => 9900
  }
}

filter {
  grok {
    match => { "message" => "Hello %{WORD:name}" }
  }
}

output {
  stdout {
    codec => rubydebug
  }
}
input은 그냥 봐도 직관적으로 알 수 있고, output도 대략 rubdydebug라는 미리 지정된 codec 형식으로 출력을 직렬화한다는 것을 알 수 있습니다. 반면 filter는 다소 생소한데요, (미리 지정된) grok 패턴을 이용해 input으로 받은 메시지를 정규 표현식으로 패턴 매칭 시켜 일종의 "변수 이름"에 매핑하는 문법을 사용합니다.
%{SYNTAX:SEMANTIC}
즉, SYNTAX로 분석된 구문을 SEMANTIC에 매핑하는 것인데요, 여기서 SYNTAX에 올 수 있는 미리 정의된 grok 패턴을 다음의 문서에서 볼 수 있습니다.
logstash/patterns/grok-patterns
; https://github.com/elastic/logstash/blob/v1.4.2/patterns/grok-patterns
예제에서는 WORD가 사용되고 있으므로,
WORD \b\w+\b
"Hello" 단어가 오는 다음의 "한 단어"를 "name"이라는 SEMANTIC으로 매핑시켜주는 역할을 합니다. 설명이 좀 어렵지만, logstash.bat을 실행시킨 후,
C:\logstash> .\bin\logstash.bat
Java HotSpot(TM) 64-Bit Server VM warning: Option UseConcMarkSweepGC was deprecated in version 9.0 and will likely be removed in a future release.
WARNING: An illegal reflective access operation has occurred
WARNING: Illegal reflective access by org.jruby.ext.openssl.SecurityHelper (file:/C:/Users/tstusr/AppData/Local/Temp/jruby-1424/jruby564628344584854279jopenssl.jar) to field java.security.MessageDigest.provider
WARNING: Please consider reporting this to the maintainers of org.jruby.ext.openssl.SecurityHelper
WARNING: Use --illegal-access=warn to enable warnings of further illegal reflective access operations
WARNING: All illegal access operations will be denied in a future release
Sending Logstash logs to C:/logstash/logs which is now configured via log4j2.properties
[2020-09-04T14:33:10,846][INFO ][logstash.runner          ] Starting Logstash {"logstash.version"=>"7.9.0", "jruby.version"=>"jruby 9.2.12.0 (2.5.7) 2020-07-01 db01a49ba6 Java HotSpot(TM) 64-Bit Server VM 11.0.8+10-LTS on 11.0.8+10-LTS +indy +jit [mswin32-x86_64]"}
[2020-09-04T14:33:12,831][INFO ][org.reflections.Reflections] Reflections took 49 ms to scan 1 urls, producing 22 keys and 45 values
[2020-09-04T14:33:16,704][INFO ][logstash.javapipeline    ][sample_log_io] Starting pipeline {:pipeline_id=>"sample_log_io", "pipeline.workers"=>8, "pipeline.batch.size"=>125, "pipeline.batch.delay"=>50, "pipeline.max_inflight"=>1000, "pipeline.sources"=>["C:/logstash/config/sample.conf"], :thread=>"#<Thread:0x2c63791c run>"}
[2020-09-04T14:33:17,556][INFO ][logstash.javapipeline    ][sample_log_io] Pipeline Java execution initialization time {"seconds"=>0.83}
[2020-09-04T14:33:17,799][INFO ][logstash.javapipeline    ][sample_log_io] Pipeline started {"pipeline.id"=>"sample_log_io"}
[2020-09-04T14:33:17,811][INFO ][logstash.inputs.tcp      ][sample_log_io][434804e2a87f1e6a6e479e344cc66c63cddf7399bf4a1add6f1ec6b637001ee9] Starting tcp input listener {:address=>"0.0.0.0:9900", :ssl_enable=>"false"}
[2020-09-04T14:33:17,861][INFO ][logstash.agent           ] Pipelines running {:count=>1, :running_pipelines=>[:sample_log_io], :non_running_pipelines=>[]}
[2020-09-04T14:33:18,357][INFO ][logstash.agent           ] Successfully started Logstash API endpoint {:port=>9600}
tcp 9900 포트로 "Hello World"라는 내용을 보내면 output 필터로 콘솔이 지정되었으므로 곧바로 출력 결과가 나옵니다.
{
          "port" => 58006,
    "@timestamp" => 2020-09-04T06:51:58.301Z,
          "host" => "0:0:0:0:0:0:0:1",
      "@version" => "1",
       "message" => "\"Hello World\" \r",
          "name" => "World"
}
참고로, tcp 클라이언트를 프로그램하는 것은 귀찮으므로
netcat 등의 프로그램을 다운로드해 다음과 같이 cmd 창에서 테스트할 수 있습니다. (또는,
telnet을 이용해 됩니다.)
c:\temp> echo "Hello World" | netcat localhost 9900
"WORD" 패턴은 너무 심심하니, 역시 미리 정의된 COMBINEDAPACHELOG를 이용해 보면,
# https://github.com/elastic/logstash/blob/v1.4.2/patterns/grok-patterns

COMMONAPACHELOG %{IPORHOST:clientip} %{USER:ident} %{USER:auth} \[%{HTTPDATE:timestamp}\] "(?:%{WORD:verb} %{NOTSPACE:request}(?: HTTP/%{NUMBER:httpversion})?|%{DATA:rawrequest})" %{NUMBER:response} (?:%{NUMBER:bytes}|-)
COMBINEDAPACHELOG %{COMMONAPACHELOG} %{QS:referrer} %{QS:agent}
input {
  tcp {
    port => 9900
  }
}

filter {
    grok {
        match => {
            message => "%{COMBINEDAPACHELOG}"
        }
    }

    geoip {
        source => "clientip"
    }
}

output {
    stdout {
        codec => rubydebug
    }
}
다음과 같은 식의
apache log를 test.log 파일로 저장한 후,
83.149.9.216 - - [17/May/2015:10:05:03 +0000] "GET /presentations/logstash-monitorama-2013/images/kibana-search.png HTTP/1.1" 200 203023 "http://semicomplete.com/presentations/logstash-monitorama-2013/" "Mozilla/5.0 (Macintosh; Intel Mac OS X 10_9_1) AppleWebKit/537.36 (KHTML, like Gecko) Chrome/32.0.1700.77 Safari/537.36"
logstash로 전달해 보면,
c:\temp> type test.log | netcat localhost 9900
apache log도 이렇게 가뿐하게 해석/출력을 합니다.
{
           "port" => 61147,
     "@timestamp" => 2020-09-05T15:22:17.939Z,
           "host" => "0:0:0:0:0:0:0:1",
       "response" => "200",
      "timestamp" => "17/May/2015:10:05:03 +0000",
        "request" => "/presentations/logstash-monitorama-2013/images/kibana-search.png",
           "verb" => "GET",
       "clientip" => "83.149.9.216",
          "bytes" => "203023",
       "referrer" => "\"http://semicomplete.com/presentations/logstash-monitorama-2013/\"",
          "ident" => "-",
       "@version" => "1",
           "auth" => "-",
          "geoip" => {
              "timezone" => "Europe/Moscow",
           "postal_code" => "144700",
             "longitude" => 37.6172,
             "city_name" => "Moscow",
           "region_code" => "MOW",
              "location" => {
            "lat" => 55.7527,
            "lon" => 37.6172
        },
           "region_name" => "Moscow",
                    "ip" => "83.149.9.216",
              "latitude" => 55.7527,
        "continent_code" => "EU",
         "country_code3" => "RU",
          "country_name" => "Russia",
         "country_code2" => "RU"
    },
          "agent" => "\"Mozilla/5.0 (Macintosh; Intel Mac OS X 10_9_1) AppleWebKit/537.36 (KHTML, like Gecko) Chrome/32.0.1700.77 Safari/537.36\"",
        "message" => "83.149.9.216 - - [17/May/2015:10:05:03 +0000] \"GET /presentations/logstash-monitorama-2013/images/kibana-search.png HTTP/1.1\" 200 203023 \"http://semicomplete.com/presentations/logstash-monitorama-2013/\" \"Mozilla/5.0 (Macintosh; Intel Mac OS X 10_9_1) AppleWebKit/537.36 (KHTML, like Gecko) Chrome/32.0.1700.77 Safari/537.36\"",
    "httpversion" => "1.1"
}
Logstash가 유명하게 된 것은, 바로 사전 정의한 "Input/Output/Filter/Codec" 플러그인을 다양하게 제공한다는 점입니다.
Input plugins
; https://www.elastic.co/guide/en/logstash/current/input-plugins.html

Output plugins
; https://www.elastic.co/guide/en/logstash/current/output-plugins.html

Filter plugins
; https://www.elastic.co/guide/en/logstash/current/filter-plugins.html

Codec plugins
; https://www.elastic.co/guide/en/logstash/current/codec-plugins.html
Elastic Stack이라는 이름에 걸맞게 Output 플러그인 중에는 elastic search도 있어서, 이전의 파이프라인을 다음과 같이 바꿔주면,
input {
  tcp {
    port => 9900
  }
}

filter {
    grok {
        match => {
            message => "%{COMBINEDAPACHELOG}"
        }
    }

    geoip {
        source => "clientip"
    }
}

output {
    elasticsearch {
        hosts => ["localhost:9200"]
    }
}
해석한 Apache log를 elasticsearch로 보내 이후 Kibana를 이용한 Dashboard를 구성할 수 있습니다. 몇 가지 더 볼까요? ^^
문서에 보면 twitter도 있는데, 따라서 아래와 같이 파이프라인을 정의하면,
input {
    twitter {
        consumer_key => ""
        consumer_secret => ""
        oauth_token => ""
        oauth_token_secret => ""
        keywords => [ "elastic", "logstash" ]
        full_tweet => true
        use_samples => true
    }
}

output {
    elasticsearch {
        hosts => ["localhost:9200"]
    }
}
twitter로부터 키워드가 "elastic"과 "logstash"를 포함하는 트윗을 읽어와 elasticsearch에 전달하게 됩니다. 또는 다음과 같이 다중 output을 지정하면,
input { ... }

filter { ... }

output {
    elasticsearch {
        hosts => ["localhost:9200"]
    }

    s3 {
        access_key_id => ""
        secret_access_key => ""
        region => "eu-west-1"
        bucket => "my_bucket"
        size_file => 2048
        time_file => 5
    }
}
elasticsearch 및 아마존 S3에 보낼 수 있습니다. input으로는 jdbc를 이용한 DB 접근도 할 수 있는 등,
input {
    jdbc {
        jdbc_user => "mysql"

        schedule => "**cron_tab_format**"
        parameters => { "company" => "elastic" }
        use_column_value => true
        tracking_column => id

        statment => "SELECT * FROM my_table WHERE id > :sql_last_value"
    }
}

filter { ... }

output { ... }
자신의 환경에 따라 이미 제공되는 다양한 플러그인을 활용하는 재미가 있습니다.
아울러, 동영상에서 자세한 내용은 소개하고 있진 않지만 logstash 자체도 (기본 포트는 9600) Rest API를 제공한다는 것!
// curl localhost:9600/_node/stats?pretty

C:\logstash\config> curl localhost:9600/_node?pretty
{
  "host" : "testpc",
  "version" : "7.9.0",
  "http_address" : "127.0.0.1:9600",
  "id" : "1d243593-01d6-48c0-a4fe-a2e4c9f42e4d",
  "name" : "testpc",
  "ephemeral_id" : "3200b6f9-b3cc-45a7-a765-7164e8a48f67",
  "status" : "green",
  "snapshot" : false,
  "pipeline" : {
    "workers" : 8,
    "batch_size" : 125,
    "batch_delay" : 50
  },
  "pipelines" : {
    "sample_log_io" : {
      "ephemeral_id" : "cc9815fa-c3d8-43a1-a67d-3cd1deed9dc9",
      "hash" : "79f402af7f2ea776e352fde9e0075868818e962ca2421702ec00863d8fd086d5",
      "workers" : 8,
      "batch_size" : 125,
      "batch_delay" : 50,
      "config_reload_automatic" : true,
      "config_reload_interval" : 3000000000,
      "dead_letter_queue_enabled" : false
    }
  },
  "os" : {
    "name" : "Windows 10",
    "arch" : "amd64",
    "version" : "10.0",
    "available_processors" : 8
  },
  "jvm" : {
    "pid" : 1424,
    "version" : "11.0.8",
    "vm_version" : "11.0.8",
    "vm_vendor" : "Oracle Corporation",
    "vm_name" : "Java HotSpot(TM) 64-Bit Server VM",
    "start_time_in_millis" : 1599197588077,
    "mem" : {
      "heap_init_in_bytes" : 1073741824,
      "heap_max_in_bytes" : 1037959168,
      "non_heap_init_in_bytes" : 7667712,
      "non_heap_max_in_bytes" : 0
    },
    "gc_collectors" : [ "ParNew", "ConcurrentMarkSweep" ]
  }
}
기타...
FLUME - 아파치
Scribe - 페이스북 오픈 소스 (실시간 스트리밍 로그 수집)
Chukwa - 아파치 인큐베이터 프로젝트, 하둡의 서브 프로젝트
Fluentd - 오픈 소스 데이터 수집기
[이 글에 대해서 여러분들과 의견을 공유하고 싶습니다. 틀리거나 미흡한 부분 또는 의문 사항이 있으시면 언제든 댓글 남겨주십시오.]