Beats용 Kibana 기본 대시 보드 구성 방법
예를 들어, FileBeat를 이용해 IIS 로그를 취합중인 경우 여러분들이 직접 IIS를 위한 Kibana 대시보드를 만드는 것도 가능합니다. 그렇긴 하지만 (저처럼 초보자라면) Elastic Stack에서 미리 만들어 둔 기본 대시 보드를 봐두는 것도 나쁘진 않기 때문에 테스트 용도의 ES에서는 구성할만합니다.
사실 방법도 매우 단순하고, 게다가 이미 실행 중인 Kibana가 있다면 다음의 URL에서 친절하게 설명도 해주고 있습니다.
IIS logs
; http://localhost:5601/app/home#/tutorial/iisLogs
단순히 이 글에서는 정리 차원에서 간단하게 기록을 남겨봅니다. ^^
우선, 다음과 같이 제품들을 다운로드해 압축을 풀어놓았다고 가정하면,
TESTSRV 머신:
    Elasticsearch 설치
    Kibana 설치

TESTCLNT 머신:
    Beat 설치
TESTCLNT의 filebeat.yml을 편집해 TESTSRV에 설치한 Elasticsearch, Kibana에 대한 경로를 (여러분들의 환경에 맞게) 적절하게 설정한 후,
output.elasticsearch:
  hosts: ["192.168.100.50:9200"]

setup.kibana:
  host: "192.168.100.50:5601"
"setup" 인자로 filebeat를 실행하면 됩니다.
C:\filebeat> filebeat.exe setup
Overwriting ILM policy is disabled. Set `setup.ilm.overwrite: true` for enabling.

Index setup finished.
Loading dashboards (Kibana must be running and reachable)
Loaded dashboards
Setting up ML using setup --machine-learning is going to be removed in 8.0.0. Please use the ML app instead.
See more: https://www.elastic.co/guide/en/machine-learning/current/index.html
Loaded machine learning job configurations
Loaded Ingest pipelines
혼동하지 말아야 할 것은, "setup" 인자로 실행되는 환경 구성은 Elasticsearch, Kibana에 대해 수행되는 것일 뿐 정작 TESTCLNT 컴퓨터 내의 FileBeat를 위한 "설치" 과정과는 무관하다는 점입니다. (물론, Filebeat.exe는 단독으로 실행 가능한 파일이므로 기타 설치 과정이 필요하지 않습니다.)
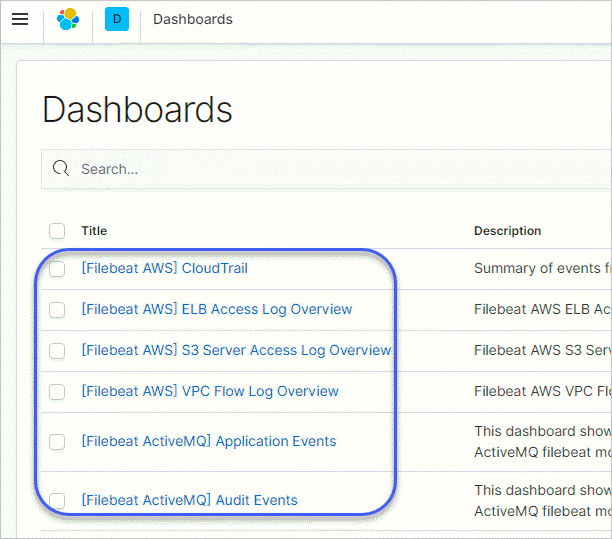
참고로, 위의 명령어는 Kibana가 제공하는 여러 종류의 기본 대시보드 유형을 한꺼번에 설정하기 때문에 이후 Kibana를 방문하면 다음과 같이 다양한 대시 보드 목록을 확인할 수 있습니다.
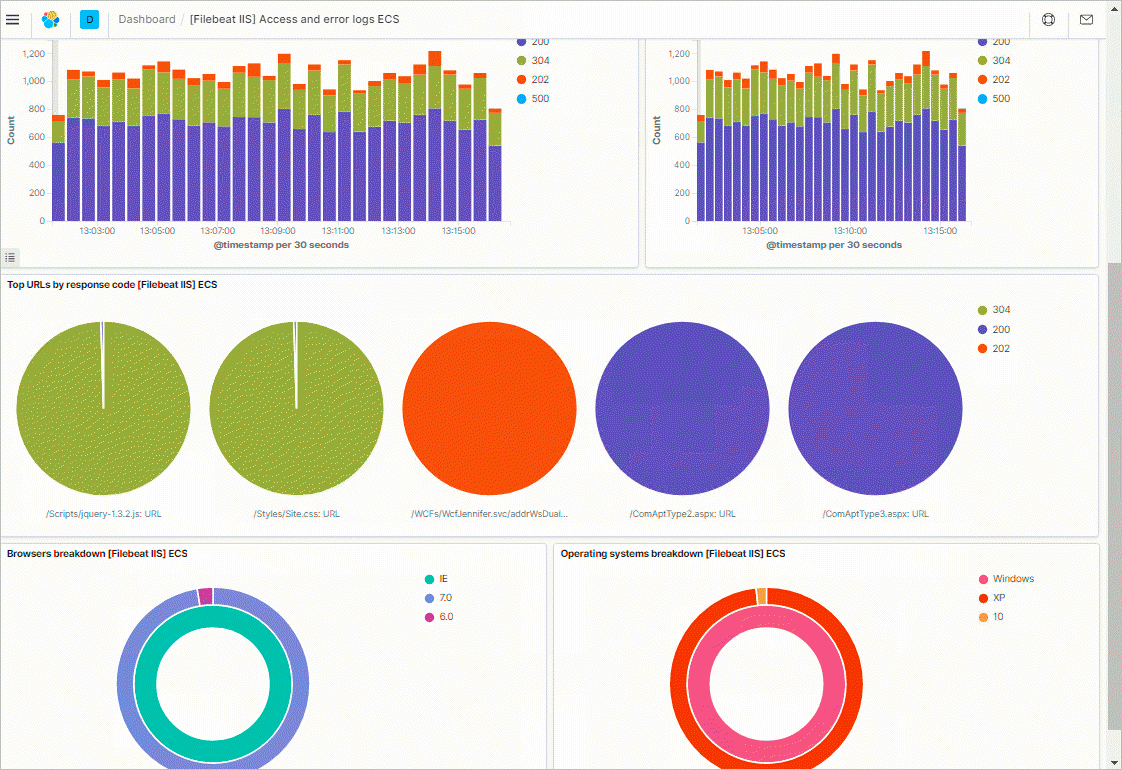
그중에서 아래는 "[Filebeat IIS] Access an error logs ECS" 대시보드 화면의 일부입니다.
"setup" 명령어 수행 시 다음과 같은 오류가 발생한다면?
C:\filebeat> filebeat.exe setup
Exiting: Index management requested but the Elasticsearch output is not configured/enabled
"filebeat.yml"에서 "output.logstash"로만 데이터 출력을 경유하는 구성을 하면 안 됩니다. 대신 "output.elasticsearch"로 곧바로 전달하는 구성을 해야 합니다.
또는, 다음과 같은 오류가 발생한다면?
C:\filebeat> filebeat.exe setup
Overwriting ILM policy is disabled. Set `setup.ilm.overwrite: true` for enabling.

Index setup finished.
Loading dashboards (Kibana must be running and reachable)
Exiting: error connecting to Kibana: fail to get the Kibana version: HTTP GET request to http://localhost:5601/api/status fails: fail to execute the HTTP GET request: Get "http://localhost:5601/api/status": dial tcp [::1]:5601: connectex: No connection could be made because the target machine actively refused it.. Response: .
오류 메시지에 따라 localhost의 Kibana로 접속을 시도한 것이기 때문에 "filebeat.yml"에서 "setup.kibana" 기본값을 바꿔야 합니다.
# This requires a Kibana endpoint configuration.
setup.kibana:

  # Kibana Host
  # Scheme and port can be left out and will be set to the default (http and 5601)
  # In case you specify and additional path, the scheme is required: http://localhost:5601/path
  # IPv6 addresses should always be defined as: https://[2001:db8::1]:5601
  host: "192.168.100.50:5601"
그런데, 그래도 다음과 같은 오류가 발생한다면?
C:\filebeat> filebeat.exe setup
Overwriting ILM policy is disabled. Set `setup.ilm.overwrite: true` for enabling.

Index setup finished.
Loading dashboards (Kibana must be running and reachable)
Exiting: error connecting to Kibana: fail to get the Kibana version: HTTP GET request to http://192.168.100.50:5601/api/status fails: fail to execute the HTTP GET request: Get "http://192.168.100.50:5601/api/status": dial tcp 192.168.100.50:5601: connectex: No connection could be made because the target machine actively refused it.. Response: .
Kibana가 설치된 PC에서 5601 포트로 대기하고 있는 IP를 확인해 보고,
C:\Users\kevin> netstat -ano | findstr 5601
  TCP    127.0.0.1:5601         0.0.0.0:0              LISTENING       16592
저렇게 "127.0.0.1"로 바인딩되어 있으면 외부에서 접속할 수 없으므로, Kibana가 설치된 서버에서 "kibana.yml" 파일의 "server.host" 값을 편집해야 합니다.
# 이렇게 설정한 경우, Kibana를 공용 IP로 접근할 수 있는 서버에 두었다면 누구나 접근할 수 있으므로,
# xpack을 설치해 로그인 설정을 하는 등의 보안을 해야 합니다.

server.host: "0.0.0.0"
[이 글에 대해서 여러분들과 의견을 공유하고 싶습니다. 틀리거나 미흡한 부분 또는 의문 사항이 있으시면 언제든 댓글 남겨주십시오.]