C# - 특정 EXE 프로세스를 종료시킨 EXE를 찾아내는 방법
다음과 같은 tweet을 봤습니다. ^^
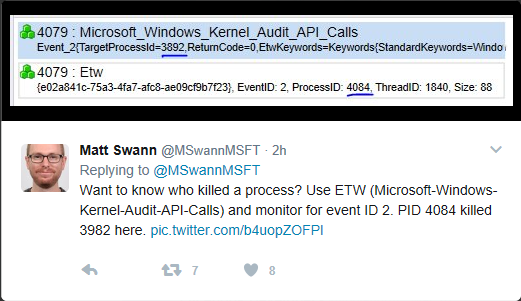
Matt Swann @MSwannMSFT  Mar 31
; https://twitter.com/MSwannMSFT/status/847576655585345536
Want to know who killed a process? Use ETW (Microsoft-Windows-Kernel-Audit-API-Calls) and monitor for event ID 2. PID 4084 killed 3982 here.
ETW를 잘 모르시는 분들은 이에 대해 어떻게 봐야 할지 막막하실 텐데요. 나름 저도 ^^ 예전에 한번 해본 적이 있는지라,
ETW(Event Tracing for Windows)를 C#에서 사용하는 방법
; https://www.sysnet.pe.kr/2/0/1804
그 경험으로 이야기를 쉽게 풀어볼까 합니다.
우선, 트윗에서 설명한 ETW (Microsoft-Windows-Kernel-Audit-API-Calls) 이벤트를 모니터링해야 합니다. 방법은, Windows SDK 8.0 이상을 설치할 때 그 SDK 내에 있는 "Windows Performance Toolkit"에 포함된 xperf.exe를 이용할 수 있습니다. 즉 다음과 같이 "관리자 권한의 cmd.exe" 창에서 실행해 주면 됩니다.
C:\Windows\system32>xperf.exe -start "TEST.Event" -on "Microsoft-Windows-Kernel-Audit-API-Calls" -f c:\temp\test.etl
위와 같이 실행해 주면, "Microsoft-Windows-Kernel-Audit-API-Calls" 범주의 ETW 이벤트를 c:\temp\test.etl 파일에 기록하는 세션을 시작하는데, 그 세션의 이름이 "TEST.Event"가 됩니다. 이후, 원하는 시간 동안 이벤트를 받게 되는데 테스트를 위해 notepad.exe를 실행한 후, 작업 관리자에서 강제 종료를 시켜 봅니다. (이때 실행한 notepad.exe의 Process ID를 기록해 둡니다. 제 경우에 17580이었습니다.)
그다음, 아래의 명령으로 세션을 종료해 줍니다.
C:\Windows\system32>xperf -stop TEST.Event
The trace you have just captured "c:\temp\test.etl" may contain personally identifiable information, including but not necessarily limited to paths to files accessed, paths to registry accessed and process names. Exact information depends on the events that were logged. Please be aware of this when sharing out this trace with other people.
모니터링 세션을 종료했으면, c:\temp\test.etl 파일을 열어 발생한 이벤트 정보를 알아낼 수 있습니다. 당연히, 이 기록에는 notepad.exe (PID: 17580)을 종료한 프로세스의 내역이 있어야 합니다. 정말 그런지 확인을 해봐야겠죠? ^^ 이를 위해 다음의 도구를 다운로드합니다.
PerfView (1.7.0)
; http://www.microsoft.com/en-us/download/details.aspx?id=28567
PerfView.exe를 실행시켜 c:\temp\test.etl 파일을 열면 다음과 같이 "EventID == 2"에 해당하는 ETW 로그를 볼 수 있습니다.
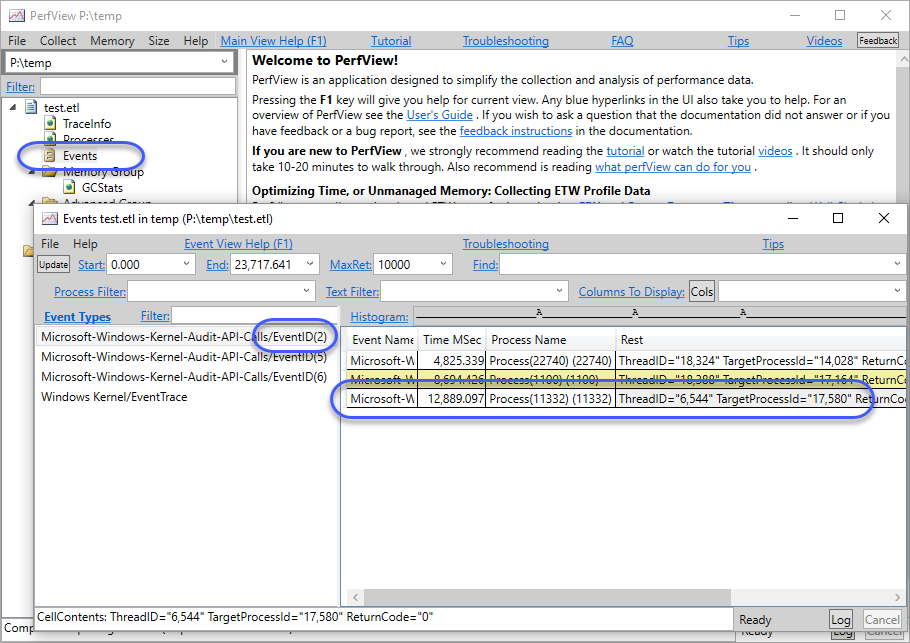
보는 바와 같이, 작업관리자(PID == 11332)가 TargetProcessId == 17580인 프로세스를 종료시킨 기록이 나옵니다.
Vista 이상의 윈도우에서는 Windows SDK(에 포함된 xperf.exe)를 굳이 설치할 필요 없이 logman.exe를 이용해서도 ETW 모니터링 세션을 열 수 있습니다.
logman start my -p "Microsoft-Windows-Kernel-Audit-API-Calls" -o c:\temp\mytest.etl -ets
이번에도 notepad.exe를 실행 후 작업 관리자에서 강제로 종료한 다음, 아래의 명령어로 모니터링 세션을 종료해 줍니다.
logman stop my -ets
마찬가지로, 생성된 mytest.etl 파일을 확인해 보면 작업 관리자가 notepad.exe의 PID를 대상으로 종료시켰음을 알 수 있습니다.
그럼, C# 코딩으로 직접 모니터링해 보는 것은 어떨까요? ^^
마침 ETW 이벤트를 쉽게 구현하도록 해 주는 "Microsoft.Diagnostics.Tracing.TraceEvent" 라이브러리가 NuGet에 올라와 있습니다. (2017-04-01 기준 v1.0.41) 또한 이를 이용한 이벤트 모니터링 예제도 다음의 Github에 있으니,
dotnet-samples/Microsoft.Diagnostics.Tracing/TraceEvent/
; https://github.com/Microsoft/dotnet-samples/tree/master/Microsoft.Diagnostics.Tracing/TraceEvent
우리는 그저 ^^ 잘 이용하기만 하면 됩니다. C# 콘솔 프로젝트를 하나 만들고, NuGet으로부터 "Microsoft.Diagnostics.Tracing.TraceEvent" 라이브러리를 추가한 다음 아래의 예제 코드를,
dotnet-samples/Microsoft.Diagnostics.Tracing/TraceEvent/TraceEvent/10_SimpleEventSourceMonitor.cs
; https://github.com/Microsoft/dotnet-samples/blob/master/Microsoft.Diagnostics.Tracing/TraceEvent/TraceEvent/10_SimpleEventSourceMonitor.cs
다음과 같이 정리해서,
using Microsoft.Diagnostics.Tracing;
using Microsoft.Diagnostics.Tracing.Session;
using System;
using System.Collections.Generic;
using System.Diagnostics;
using System.IO;

// https://github.com/Microsoft/dotnetsamples/blob/master/Microsoft.Diagnostics.Tracing/TraceEvent/TraceEvent/10_SimpleEventSourceMonitor.cs

namespace TraceEventSamples
{
    class SimpleEventSourceMonitor
    {
        static TextWriter Out = Console.Out;

        public static int Run()
        {
            // Today you have to be Admin to turn on ETW events (anyone can write ETW events).
            if (!(TraceEventSession.IsElevated() ?? false))
            {
                Out.WriteLine("To turn on ETW events you need to be Administrator, please run from an Admin process.");
                Debugger.Break();
                return -1;
            }

            var sessionName = "SimpleMontitorSession";
            using (var session = new TraceEventSession(sessionName))
            {
                Console.CancelKeyPress += delegate (object sender, ConsoleCancelEventArgs e) { session.Dispose(); };

                var firstEventTimeMSec = new Dictionary<int, double>();

                session.Source.Dynamic.All += delegate (TraceEvent data)
                {
                    if ((int)data.ID != 2)
                    {
                        return;
                    }

                    var delay = (DateTime.Now - data.TimeStamp).TotalSeconds;
                    Out.WriteLine("GOT Event Delay={0:f1}sec: {1} ", delay, data.ToString());
                };

                string etwName = "Microsoft-Windows-Kernel-Audit-API-Calls";
#if DEBUG
                session.Source.UnhandledEvents += delegate (TraceEvent data)
                {
                    if ((int)data.ID != 0xFFFE)         // The EventSource manifest events show up as unhanded, filter them out.
                        Out.WriteLine("GOT UNHANDLED EVENT: " + data.Dump());
                };
#endif

                var restarted = session.EnableProvider(etwName);
                if (restarted)      // Generally you don't bother with this warning, but for the demo we do.
                    Out.WriteLine("The session {0} was already active, it has been restarted.", sessionName);

                Out.WriteLine("**** Start listening for events from the " + etwName + " provider.");

                session.Source.Process();
                Out.WriteLine();
                Out.WriteLine("Stopping the collection of events.");
            }
            return 0;
        }
    }
}
class Program
{
    static void Main(string[] args)
    {
        TraceEventSamples.SimpleEventSourceMonitor.Run();
    }
}
실행해 주면 됩니다. 이후, 테스트를 위해 다양한 프로세스를 생성/종료를 반복하면 다음과 같은 식의 결과를 볼 수 있습니다.
**** Start listening for events from the Microsoft-Windows-Kernel-Audit-API-Calls provider.
GOT Event Delay=0.7sec: <Event MSec= "10575.2730" PID="1100" PName="" TID="21548" EventName="EventID(2)" ProviderName="Microsoft-Windows-Kernel-Audit-API-Calls" TargetProcessId="13,496" ReturnCode="-1,073,741,558"/>
GOT Event Delay=1.0sec: <Event MSec= "11212.0933" PID="1268" PName="" TID="16128" EventName="EventID(2)" ProviderName="Microsoft-Windows-Kernel-Audit-API-Calls" TargetProcessId="12,568" ReturnCode="0"/>
잘 동작하는군요. ^^
(
첨부 파일은 이 글의 예제 코드를 포함합니다.)
[이 글에 대해서 여러분들과 의견을 공유하고 싶습니다. 틀리거나 미흡한 부분 또는 의문 사항이 있으시면 언제든 댓글 남겨주십시오.]