Win32 Debug CRT Heap Internals의 0xBAADF00D 표시 재현
다음의 tweet이 있길래,
실제로 그런가 한번 해봤습니다. ^^
Wiki에 기록된 내용을 잘 소개하고 있는 글로 다음의 내용이 있습니다.
Win32 Debug CRT Heap Internals
; http://www.nobugs.org/developer/win32/debug_crt_heap.html
내용을 간략하게 정리해 보면.
debug CRT의 malloc을 이용해 8바이트를 할당받으려고 하는 경우 HeapAlloc에게 총 48바이트를 요구하지만, 다음의 그림에서와 같이 HeapAlloc 자체의 정보 및 예약 공간으로 인해 malloc에게 돌려줄 메모리의 앞으로 8바이트, 뒤로 32바이트까지 해서 총 88바이트의 공간이 소요됩니다.
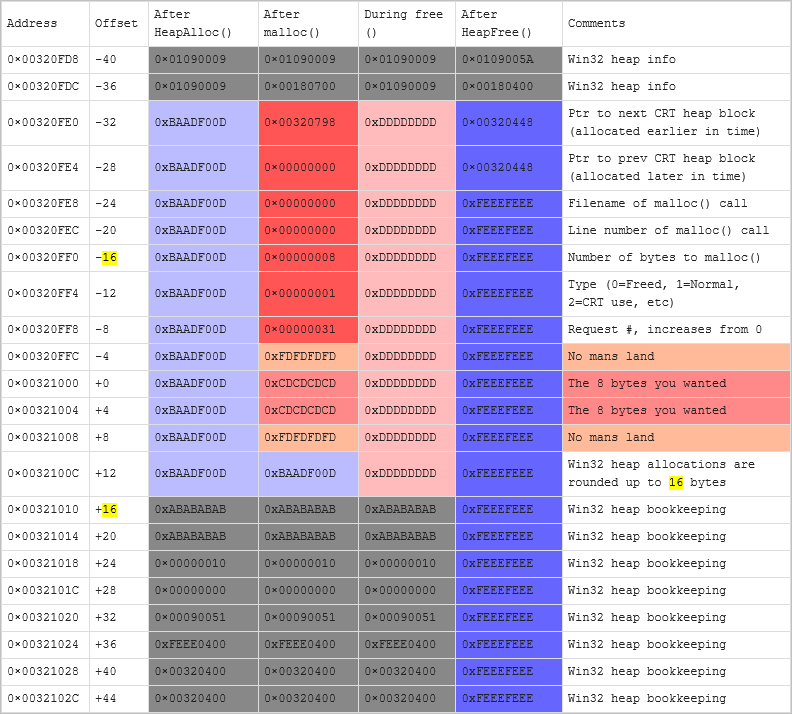
위의 내용에 따르면 malloc 호출 시 HeapAlloc으로부터 할당받은 메모리는 malloc의 처리를 거치기 전 0xBAADF00D로 채워져 있다고 되어 있습니다. 이것이 정말 사실인지, Visual Studio의 디버거 기능을 이용해 확인해봐야겠습니다. ^^
방법은 간단합니다. malloc 함수 호출에서 "Disassembly" 창을 띄워 따라가다 보면, 다음의 call stack에 따라 결국 HeapAlloc으로부터 메모리를 할당받게 됩니다. (테스트는 Visual Studio 2017 + Windows 10에서 v120_xp Platform toolset 설정으로 한 것입니다.)
__imp__HeapAlloc@12
_heap_alloc_base(unsigned int size)
_heap_alloc_dbg_impl(unsigned int nSize, int nBlockUse, const char * szFileName, int nLine, int * errno_tmp)
_nh_malloc_dbg_impl(unsigned int nSize, int nhFlag, int nBlockUse, const char * szFileName, int nLine, int * errno_tmp)
_nh_malloc_dbg(unsigned int nSize, int nhFlag, int nBlockUse, const char * szFileName, int nLine)
malloc(unsigned int nSize)
우선, debug 버전의 malloc은 8바이트 할당 요구에 대해 HeapAlloc에게 48바이트가 아닌 44바이트의 공간을 요구합니다. 또한, HeapAlloc 호출 후 @eax 레지스터의 내용(0x01756EC8)에 따라 다음과 같이 메모리 창으로 확인해 봤지만 0xBAADF00D 패턴은 찾을 수 없었습니다.
0x01756EC8  c0 00 75 01  ?.u.
0x01756ECC  e0 71 75 01  ?qu.
0x01756ED0  05 00 00 05  ....
0x01756ED4  46 d6 00 00  F?..
0x01756ED8  d0 70 75 01  ?pu.
0x01756EDC  c0 00 75 01  ?.u.
0x01756EE0  2d 00 6c 00  -.l.
0x01756EE4  30 00 2d 00  0.-.
0x01756EE8  02 00 00 02  ....
0x01756EEC  47 d6 00 00  G?..
0x01756EF0  d0 70 75 01  ?pu.
하지만, CRT에 의해 채워지는 내용은 "
Win32 Debug CRT Heap Internals" 문서에 따라 그대로 수행되었습니다. 이 작업은 _heap_alloc_dbg_impl에 의해 이뤄지고 다음과 같이 crt Debug 정보로 채워지게 됩니다.
0x01756EC8  68 c0 75 01     [Ptr to next CRT heap block (allocated earlier in time)]
0x01756ECC  00 00 00 00     [Ptr to prev CRT heap block (allocated later in time)]
0x01756ED0  00 00 00 00     [Filename of malloc() call]
0x01756ED4  00 00 00 00     [Line number of malloc() call]
0x01756ED8  08 00 00 00     [Number of bytes to malloc()]
0x01756EDC  01 00 00 00     [Type (0=Freed, 1=Normal, 2=CRT use, etc)]
0x01756EE0  55 00 00 00     [Request #, increases from 0]
0x01756EE4  fd fd fd fd     [_bNoMansLandFill == 0xfd]
0x01756EE8  cd cd cd cd     [_bCleanLandFill == 0xcd] // 사용자가 요구한 8바이트
0x01756EEC  cd cd cd cd     [_bCleanLandFill == 0xcd] // 사용자가 요구한 8바이트
0x01756EF0  fd fd fd fd     [_bNoMansLandFill == 0xfd]
또한, 사용자가 요구한 메모리는 0xCD로 초기화되었고 그전/후 4바이트는 역시 0xfd로 채워져 있었습니다.
테스트를 위해, "
Win32 Debug CRT Heap Internals" 문서의 내용에서 보여주는 offset 값에 따라 debug malloc 호출에 따른 메모리 덤프를 해보았습니다. (
소스 코드는 이 글의 첨부 파일에 있습니다.)
다음은 이 프로그램을 Windows 2003 x86 버전에서 실행한 결과입니다.
offset: -40(at 0x00154cf0) == 0x00440007 [Win32 heap info]
offset: -36(at 0x00154cf4) == 0x000c01a4 [Win32 heap info]
offset: -32(at 0x00154cf8) == 0x00156008 [Ptr to next CRT heap block (allocated earlier in time)]
offset: -28(at 0x00154cfc) == 0x00000000 [Ptr to prev CRT heap block (allocated later in time)]
offset: -24(at 0x00154d00) == 0x00000000 [Filename of malloc() call]
offset: -20(at 0x00154d04) == 0x00000000 [Line number of malloc() call]
offset: -16(at 0x00154d08) == 0x00000008 [Number of bytes to malloc()]
offset: -12(at 0x00154d0c) == 0x00000001 [Type (0=Freed, 1=Normal, 2=CRT use, etc)]
offset: -08(at 0x00154d10) == 0x00000040 [Request #, increases from 0]
offset: -04(at 0x00154d14) == 0xfdfdfdfd [No mans land]

offset: 000(at 0x00154d18) == 0xcdcdcdcd [The 8 bytes you wanted]
offset: 004(at 0x00154d1c) == 0xcdcdcdcd [The 8 bytes you wanted]

offset: 008(at 0x00154d20) == 0xfdfdfdfd [No mans land]

offset: 012(at 0x00154d24) == 0xdddddddd [Win32 heap allocations are rounded up to 16 bytes]

offset: 016(at 0x00154d28) == 0x000700bf [Win32 heap bookkepping]
offset: 020(at 0x00154d2c) == 0x00dd00dd [Win32 heap bookkepping]
offset: 024(at 0x00154d30) == 0x00157038 [Win32 heap bookkepping]
offset: 028(at 0x00154d34) == 0x00150178 [Win32 heap bookkepping]
offset: 032(at 0x00154d38) == 0xdddddddd [Win32 heap bookkepping]
offset: 036(at 0x00154d3c) == 0xdddddddd [Win32 heap bookkepping]
offset: 040(at 0x00154d40) == 0xdddddddd [Win32 heap bookkepping]
offset: 044(at 0x00154d44) == 0xdddddddd [Win32 heap bookkepping]
일단, 파란색 굵은 선 내의 내용은 _heap_alloc_dbg_impl에 의해 채워지는 것을 확인한 것으로 MSDN 문서에서도 이에 대해 잘 설명하고 있습니다.
CRT Debug Heap Details
; https://docs.microsoft.com/en-us/previous-versions/visualstudio/visual-studio-2015/debugger/crt-debug-heap-details
typedef struct _CrtMemBlockHeader
{
// Pointer to the block allocated just before this one:
    struct _CrtMemBlockHeader *pBlockHeaderNext;
// Pointer to the block allocated just after this one:
    struct _CrtMemBlockHeader *pBlockHeaderPrev;
    char *szFileName;    // File name
    int nLine;           // Line number
    size_t nDataSize;    // Size of user block
    int nBlockUse;       // Type of block
    long lRequest;       // Allocation number
// Buffer just before (lower than) the user's memory:
    unsigned char gap[nNoMansLandSize];
} _CrtMemBlockHeader;

/* In an actual memory block in the debug heap,
 * this structure is followed by:
 *   unsigned char data[nDataSize];
 *   unsigned char anotherGap[nNoMansLandSize];
 */
하지만 그 외의 내용은 "
Win32 Debug CRT Heap Internals" 문서에 따르면 HeapAlloc에 의해 부가적으로 할당되는 영역이라고 하는데 (물론 있긴 하겠지만) 딱히 문서의 내용에 따라 보이는 것 같지는 않습니다. (즉, heap 관련 메모리 분석은 현재로서는 불확실합니다.)
여기서 재미있는 것이 있는데요. _CrtMemBlockHeader->pBlockHeaderNext 포인터가 바로 전의 CRT 메모리 블록을 가리킨다는 점입니다. 실제로 위의 출력 결과에서 -32 오프셋 위치에 있는 0x00156008 메모리가 가리키는 내용은 이전에 할당되었던 _CrtMemBlockHeader의 pBlockHeaderNext 위치를 가리킵니다. 따라서 이 정보를 기반으로 다시 덤프를 해보면 대략 이런 정보를 얻게 됩니다.
========== ptrToNext 0x156008 =========
offset: -40(at 0x00156000) == 0x00090206 [Win32 heap info]
offset: -36(at 0x00156004) == 0x000c013a [Win32 heap info]
offset: -32(at 0x00156008) == 0x00154a28 [Ptr to next CRT heap block (allocated earlier in time)]
offset: -28(at 0x0015600c) == 0x00154cf8 [Ptr to prev CRT heap block (allocated later in time)]
offset: -24(at 0x00156010) == 0x00491844 [Filename of malloc() call]
offset: -20(at 0x00156014) == 0x0000005b [Line number of malloc() call]
offset: -16(at 0x00156018) == 0x00001000 [Number of bytes to malloc()]
offset: -12(at 0x0015601c) == 0x00000002 [Type (0=Freed, 1=Normal, 2=CRT use, etc)]
offset: -08(at 0x00156020) == 0x0000003f [Request #, increases from 0]
offset: -04(at 0x00156024) == 0xfdfdfdfd [No mans land]
... 이하 0x1000 바이트는 이전에 malloc(0x1000)으로 할당받은 메모리 ...
그리고, -08 위치의 "Request #"도 1이 줄어 있습니다. 즉, 우리가 malloc한 메모리는 0x40(64) 번째 할당했던 메모리였던 것입니다. 이런 식이라면, debug 빌드에서의 malloc 메모리를 모두 덤프할 수 있을 것입니다. ^^
테스트를 마치고, "Win32 Debug CRT Heap Internals" 문서의 작성일이 궁금했습니다. 문서에 보면 그 내용을 담고 있다는 책 "Debugging Windows Programs"의 발행 연도가 2000년 8월 28일로 된 것으로 봐서 아마도 Windows 2000 이전의 운영체제에서는 0xBAADF00D 표시가 있었을 것입니다. 하지만 적어도 Windows Server 2003부터는 더 이상 0xBAADF00D 표시는 쓰지 않는 듯싶으니 결국 역사적인 내용으로만 알면 되겠습니다.
트친인
@taehwalee 님이 0xBAADF00D 상태를 재현할 수 있는 힌트를 주었습니다. ^^
C:\Program Files (x86)\Windows Kits\10\Debuggers\x64\gflags.exe
C:\Program Files (x86)\Windows Kits\10\Debuggers\x86\gflags.exe
gflags를 이용해 "Enable heap free checking" 또는 "Enable heap parameter checking" 또는 "Enable heap validation on call" 중의 하나를 활성화 시키면,
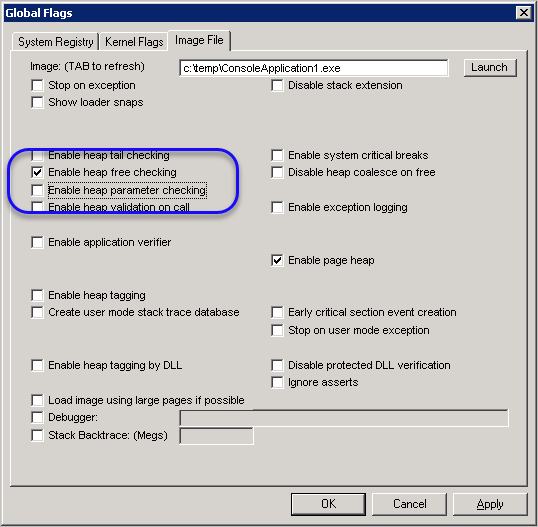
다음과 같이 간단히 테스트해 볼 수 있습니다.
HANDLE hHeap = HeapCreate(0, 1024, 1024);
LPVOID pVoid = HeapAlloc(hHeap, 0, 8);

DWORD *pData = (DWORD *)pVoid;

for (int i = 0; i < 2; i++)
{
    DWORD value = *(pData + i);
    printf("offset: %03d(at 0x%08x) == 0x%08x\n", i * 4, (pData + i), value);
}

/*
출력 결과:

offset: 000(at 0x019a04a0) == 0xbaadf00d
offset: 004(at 0x019a04a4) == 0xbaadf00d
*/
검색하니 다음의 글에 이에 대한 옵션 소개가 있습니다. ^^
Heap Magic: Process Heap Internals, Part 2
; http://devproconnections.com/development/heap-magic-process-heap-internals-part-2
참고로, 각각의 옵션에 대한 단축 이름은 다음과 같습니다.
hfc - Enable heap free checking
hpc - Enable heap parameter checking
hvc - Enable heap validation on call

예)
gflags /i TestApp.exe +hpc
[이 글에 대해서 여러분들과 의견을 공유하고 싶습니다. 틀리거나 미흡한 부분 또는 의문 사항이 있으시면 언제든 댓글 남겨주십시오.]