Netsh의 네트워크 모니터링 기능
오호~~~ 재미있는 것을 하나 알았습니다. ^^ 바로 아래의 글에 소개된 Netsh에 관한 이야기입니다.
Netsh Trace - Use It!
; https://chentiangemalc.wordpress.com/2012/02/22/netsh-traceuse-it/
정리하면 Netsh 명령어로 특정 프로그램의 네트워크 사용에 대한 패킷을 볼 수 있는 것입니다. 간단하게 실습해 볼까요? ^^
다음과 같이 배치 파일을 만들어 특정 프로세스가 수행하는 동안의 네트워크 패킷을 살펴보겠습니다.
REM trace_net.bat

netsh trace start capture=YES report=YES persistent=YES

REM ...[run your process]...

netsh trace stop
예제 프로그램으로는 TCP 클라이언트를 하나 만들고,
using System;
using System.Diagnostics;
using System.Net;
using System.Net.Sockets;

class Program
{
    static void Main(string[] args)
    {
        Console.WriteLine("Currnet Process Id: " + Process.GetCurrentProcess().Id);
        string target = "192.168.0.252";
        int port = 10320;

        IPAddress targetAddress = IPAddress.Parse(target);;
        Console.WriteLine("IPAddress: {0}", targetAddress);

        IPEndPoint ep = new IPEndPoint(targetAddress, port);

        TcpClient client = new TcpClient();

        Console.WriteLine("Connecting to {0}", ep);
        try
        {
            client.Connect(ep);
            Console.WriteLine("Connected");
        }
        catch (Exception e)
        {
            Console.WriteLine("Failed: " + e.ToString());
        }

        client.Close();
    }
}
존재하지도 않는 IP로 연결을 맺는 경우의 네트워크 패킷을 확인해 보겠습니다. (관리자 권한의 cmd.exe 창에서 실행해야 합니다.)
c:\temp\ConsoleApplication1\bin\Debug> trace_net.bat

c:\temp\ConsoleApplication1\bin\Debug> netsh trace start capture=YES report=YES persistent=YES

Trace configuration:
-------------------------------------------------------------------
Status:             Running
Trace File:         %LOCALAPPDATA%\Temp\NetTraces\NetTrace.etl
Append:             Off
Circular:           On
Max Size:           250 MB
Report:             On

c:\temp\ConsoleApplication1\bin\Debug>ConsoleApplication1.exe 192.168.0.252
Currnet Process Id: 14208
IPAddress: 192.168.0.252
Connecting to 192.168.0.252:10320
Failed: System.Net.Sockets.SocketException (0x80004005): A connection attempt failed because the connected party did not
 properly respond after a period of time, or established connection failed because connected host has failed to respond
192.168.0.252:10320
   at System.Net.Sockets.Socket.DoConnect(EndPoint endPointSnapshot, SocketAddress socketAddress)
   at System.Net.Sockets.Socket.Connect(EndPoint remoteEP)
   at System.Net.Sockets.TcpClient.Connect(IPEndPoint remoteEP)
   at ConsoleApplication1.Program.Main(String[] args) in c:\temp\ConsoleApplication1\Program.cs:line 53

c:\temp\ConsoleApplication1\bin\Debug>netsh trace stop
Correlating traces ... done
Merging traces ... done
Generating data collection and report ... done
The trace file and additional troubleshooting information have been compiled as "%LOCALAPPDATA%\Temp\NetTraces\NetTrace.cab".
Tracing session was successfully stopped.
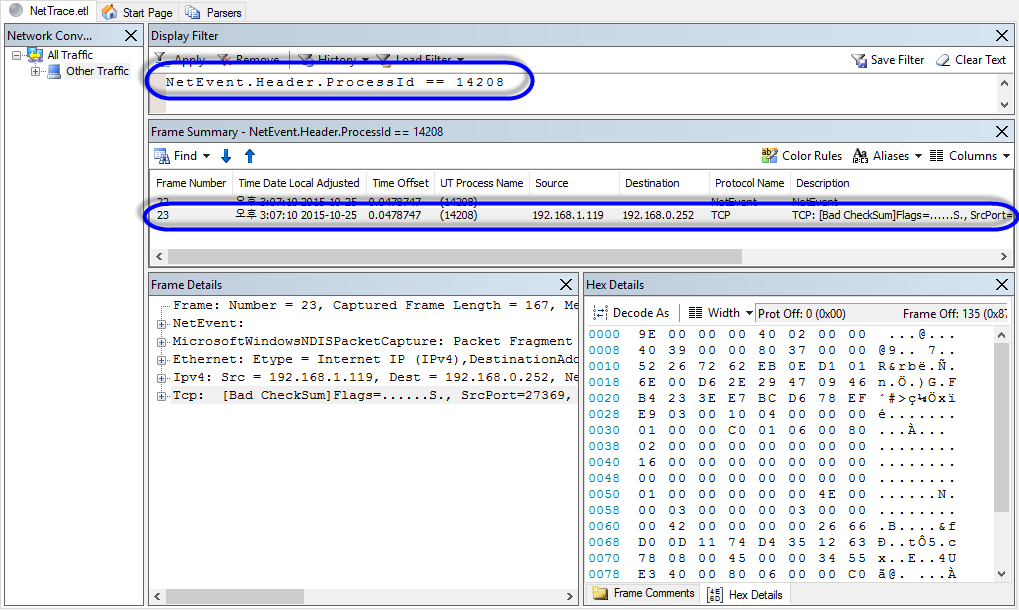
완료 후, 2개의 파일(NetTrace.cab, NetTrace.etl)이 생성되는데 cab 파일은 etl 파일과 함께 여러 부가 정보를 함께 압축시킨 정도입니다. 따라서 그냥 NetTrace.etl 파일을 Microsoft Network Monitor를 이용해 읽어들인 후 프로세스 ID로 필터링하면 다음과 같이 1개의 TCP 패킷이 단방향으로 전송된 것을 볼 수 있습니다.
기존의 네트워크 모니터 프로그램이,
Network Monitor 3.4
; https://www.microsoft.com/en-US/download/details.aspx?id=4865
요 근래 Message Analyzer로 바뀌었습니다.
Microsoft Message Analyzer
; https://www.microsoft.com/en-us/download/details.aspx?id=44226
새로운 도구를 이용해 볼까요? ^^ 이번엔 TCP 연결을 받은 후 바로 끊는 서버 프로그램도 만들어 (다른 컴퓨터에 실행해) 놓고,
using System;
using System.Net;
using System.Net.Sockets;

class Program
{
    static void Main(string[] args)
    {
        int port = 10320;
        Console.WriteLine(string.Format("TcpListener({0})", port));
        TcpListener listener = new TcpListener(IPAddress.Any, port);

        listener.Start();

        while (true)
        {
            Console.WriteLine("Waiting for client...");
            TcpClient client = listener.AcceptTcpClient();
            Console.WriteLine("Connected from {0}", client.Client.RemoteEndPoint);
            client.Close();
            Console.WriteLine("Connection Closed");
            Console.WriteLine();
        }
    }
}
클라이언트 측에서는 연결만 하고 1초 대기 후 끊도록 바꾼 후,
TcpClient client = new TcpClient();

Console.WriteLine("Connecting to {0}", ep);
try
{
    client.Connect(ep);
    Console.WriteLine("Connected");
    Thread.Sleep(1000);
}
catch (Exception e)
{
    Console.WriteLine("Failed: " + e.ToString());
}

client.Close();
netsh로 모니터링하면 다음과 같은 결과를 Message Analyzer에서 얻을 수 있습니다.
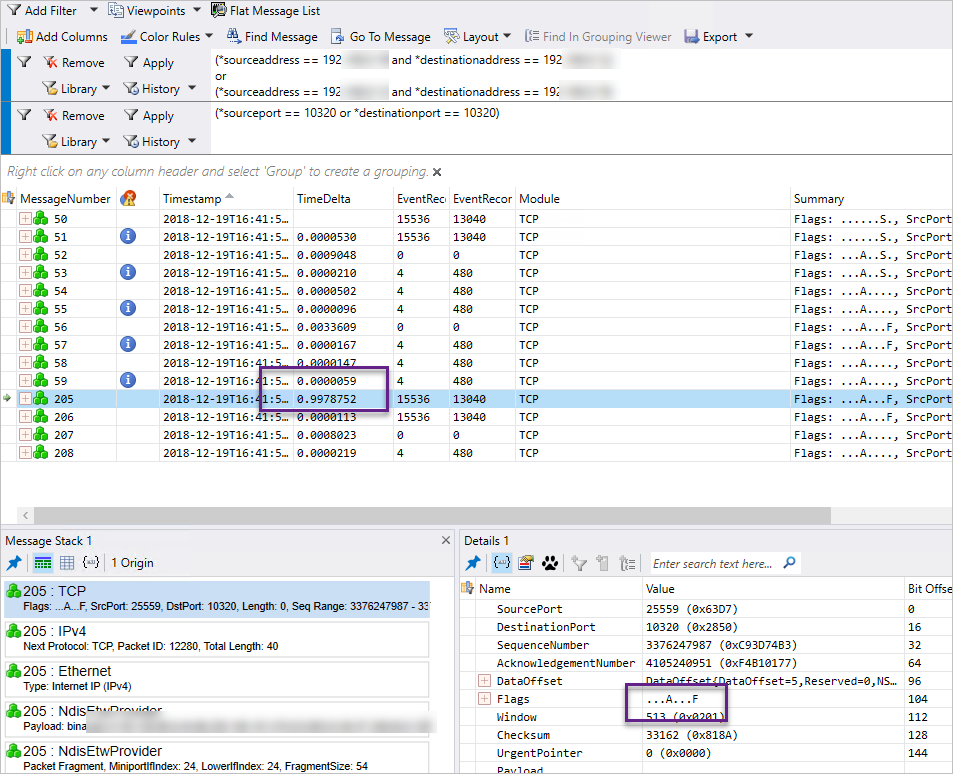
필터링 조건은 다음의 2개로 설정했습니다.
(*sourceaddress == 192.168.100.20 and *destinationaddress == 192.168.100.5)
or
(*sourceaddress == 192.168.100.5 and *destinationaddress == 192.168.100.20)
(*sourceport == 10320 or *destinationport == 10320)
이론상으로 보면, 클라이언트와 서버는 다음의 통신을 하게 됩니다.
[연결 시 3-way handshake]
Client -> SYN -> Server
Client <- SYN, ACK <- Server
Client -> ACK -> Server

[해제 시 4-way handshake]
Client <- FIN <- Server (서버 측에서 먼저 연결을 끊으므로.)
Client -> ACK -> Server

(1초 후)

Client -> FIN -> Server
Client <- ACK <- Server
그래서 총 7개의 패킷만 있어야 하는데, Message Analyzer의 결과를 보면 14개가 있습니다. 패킷 데이터를 보면 동일한 내용으로 2개씩 연이어 나오는데 단지 다른 점은 Miniport 인덱스만 틀린 것을 볼 수 있습니다. 그래서 검색 조건을 하나 더 추가해야 합니다.
*MiniportIfIndex == 24
이렇게 하면 7개의 패킷이 나오고 연결 및 해제에 대한 handshake 패킷을 순서대로 확인할 수 있습니다.
물론, 기술 근간은 ETW이기 때문에 원한다면 코딩을 이용해 직접 다루는 것도 가능할 것입니다.
ETW(Event Tracing for Windows)를 C#에서 사용하는 방법
; https://www.sysnet.pe.kr/2/0/1804
[이 글에 대해서 여러분들과 의견을 공유하고 싶습니다. 틀리거나 미흡한 부분 또는 의문 사항이 있으시면 언제든 댓글 남겨주십시오.]