Jennifersoft provides a trial promotion on its APM solution such as JENNIFER, PHP, and .NET in 2019 and shares the examples of their application.
We are promoting JENNIFER .NET APM without charge.
As of September 2, Jennifersoft starts offering JENNIFER promotion for those who want to try the software including an application operator, a developer or even for community. On top of PHP, we expand the range of promotion by adding .NET platform. If you are interested in experiencing the JENNIFER, please feel free to apply and use it free of charge for 3 months.
Please click below link to apply:
JENNIFER Promotion 2019 Indonesia
; http://bit.ly/JenniferINAPromotion2019

PENDAFTARAN FREE TRIAL APM JENNIFER
; https://www.iorad.com/player/1594390/PENDAFTARAN-FREE-TRIAL-APM-JENNIFER#trysteps-1
You are allowed to install and operate the software without charge from September 2 to November 30, 2019. If you have experienced performance related issues, now is a good chance to find what caused the problem and reinvent it by installing JENNIFER .NET APM.
Let me give you an example of .NET APM that has just been installed.
The webpage indicated above is a B2C website selling fashion items in Korea. Normally, the webpage does not show any issues, however, it radically becomes slow ever since it exports a promotional event. For this reason, the webpage administrator installed the JENNIFER .NET.
As you can see from the below, the webpage continues to respond to requests without any issues.
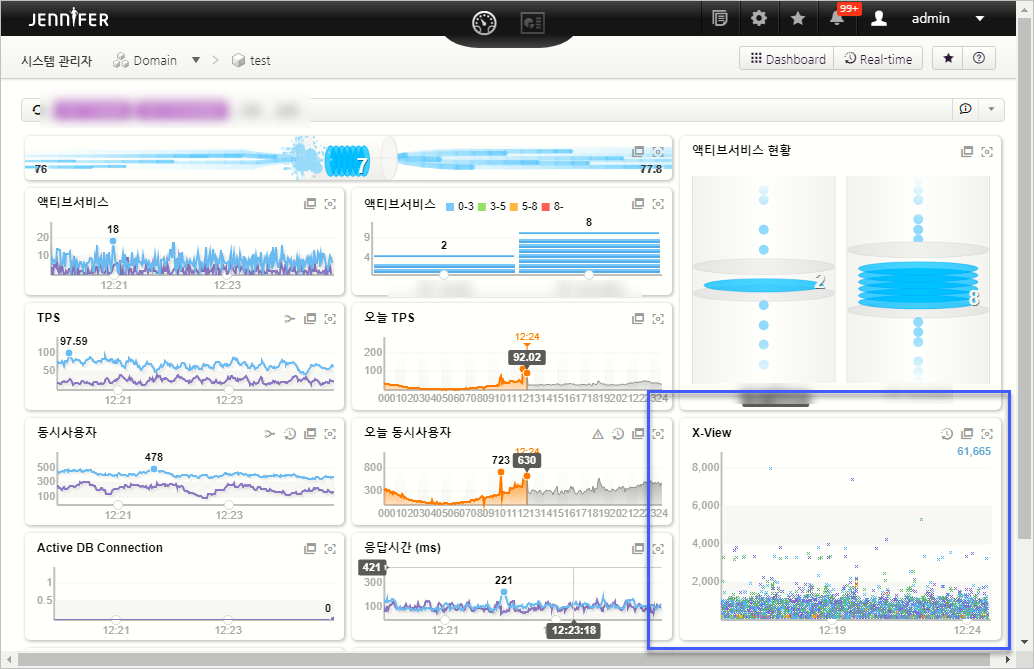
When you look at the “X-View” indicated at lower right corner of the screen, there are myriad of dots. These dots are marked on the display time of X-axis once a request is completed. The Y-axis indicates the length of time to process such request. Most of the time, dots are marked within 1 to 2 seconds (1,000ms to 2,000ms). Based on my experience, I can assure you that the webpage is one of the well-made websites, considering the fact that it is made without a monitoring tool.
Unfortunately, the webpage has been suffering from disorder due to a promotional event like below.
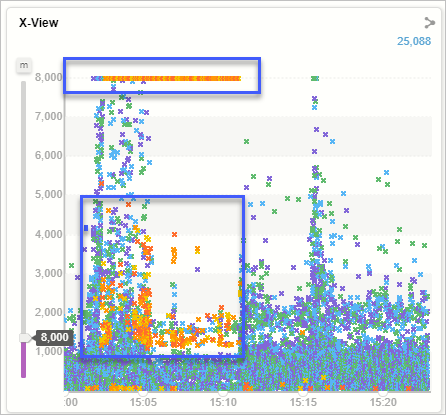
When you look at the Y-axis on X-View, lots of dots are marked on an area beyond 8 seconds (8,000ms). In other words, the response time becomes very slow as the webpage takes more than 8 seconds to complete the related requests. When I select the area where the response time becomes slow like a figure below,
[Figure:
JENNIFER-APM solution]
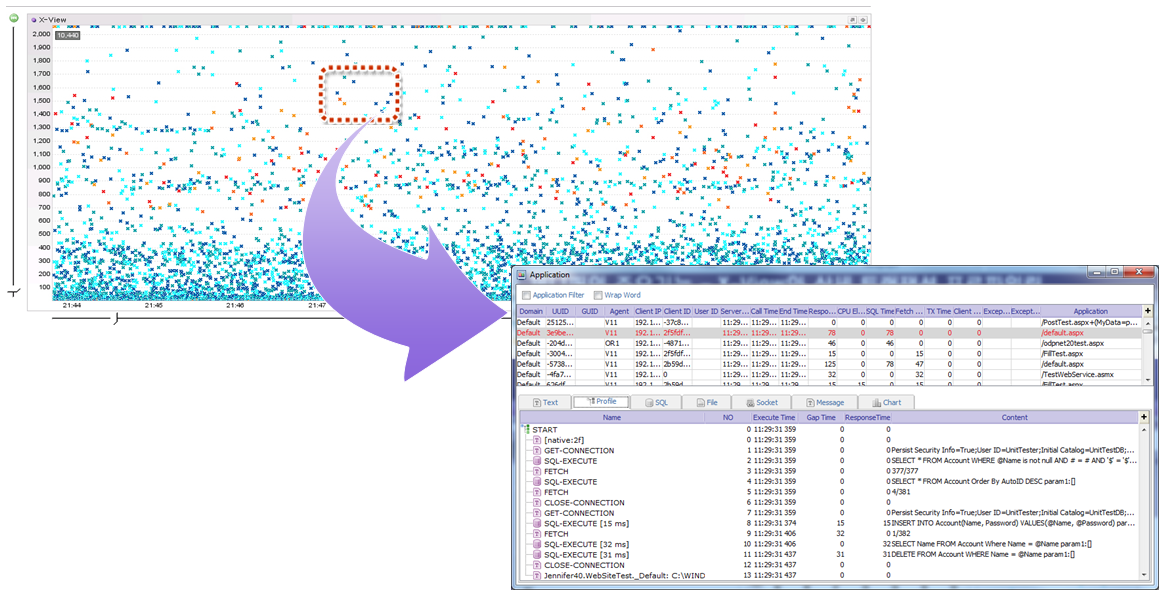
You can notice the time and the list of DB calling, and Web API calling that has occurred during the time of request. The figure indicates that it took tens of seconds at REST API calling for an outside company. Based on this result, the webpage company could come up with a solution to tackle the issue.
But the good thing is that this company was able to notice an error during the event period because the company at least conducted a basic system monitoring. Without the monitoring tool, the company could have not been noticed that they had a problem because the rapidly occurred requests by a push alarm normally end in such a short time. And it could have experienced decrease in sales and lost expense to prepare the promotion.
How do you feel now? Why don’t you find out yourself to see if you made your service reliably?
[이 글에 대해서 여러분들과 의견을 공유하고 싶습니다. 틀리거나 미흡한 부분 또는 의문 사항이 있으시면 언제든 댓글 남겨주십시오.]