Logstash - 사용자 정의 grok 패턴 추가를 이용한 IIS 로그 처리
기본을 익혔으니,
Logstash 기본 사용법
; https://www.sysnet.pe.kr/2/0/12312
IIS 로그를 Logstash로 처리하는 방법을 다뤄보겠습니다. 아쉽지만, Logstash가 제공하는 기본 grok 패턴 중에는,
logstash/patterns/grok-patterns
; https://github.com/elastic/logstash/blob/v1.4.2/patterns/grok-patterns
(아파치는 있지만) IIS 용이 없습니다. 사실, 이것은 당연한 것일 수 있는데 왜냐하면 IIS의 로그는 항목 종류를 사용자 정의할 수 있기 때문입니다. 예를 들어 IIS 로그 용의 패턴을 검색해 보면,
mrlesmithjr/logstash.conf
; https://gist.github.com/mrlesmithjr/72e99caf36fcc2b5d323
다음과 같은 형식을 구할 수 있는데,
grok {
        match => [
                "message", "%{TIMESTAMP_ISO8601:logtime} %{IPORHOST:hostname} %{URIPROTO:cs_method} %{URIPATH:cs_stem} (?:%{NOTSPACE:cs_query}|-) %{NUMBER:src_port} %{NOTSPACE:cs_username} %{IP:clientip} %{NOTSPACE:cs_useragent} %{NUMBER:sc_status} %{NUMBER:sc_subresponse} %{NUMBER:sc_win32_status} %{NUMBER:timetaken}"
        ]
}
제가 가진 테스트 서버의 IIS 로그(test.log)는 다음과 같은 형식이라서,
#Software: Microsoft Internet Information Services 10.0
#Version: 1.0
#Date: 2019-08-28 00:00:43
#Fields: date time s-ip cs-method cs-uri-stem cs-uri-query s-port cs-username c-ip cs(User-Agent) cs(Referer) sc-status sc-substatus sc-win32-status time-taken
2019-08-28 00:00:43 ::1 GET / - 8010 - ::1 Mozilla+(http://localhost:8010/.0) - 200 0 0 18
2018-12-20 04:35:30 127.0.0.1 GET /WCFs/TestCall.svc - 80 - 127.0.0.1 Mozilla/5.0+(Windows+NT+10.0;+WOW64;+Trident/7.0;+rv:11.0)+like+Gecko - 404 0 0 9744
"cs(Referer)"에 대한 항목이 없어 정상적인 파싱이 되지 않습니다. 따라서, 저한테 맞는 grok 패턴을 적용하기 위해서는 그에 대한 변경을 해야 합니다.
"message", "%{TIMESTAMP_ISO8601:logtime} %{IPORHOST:hostname} %{URIPROTO:cs_method} %{URIPATH:cs_stem} (?:%{NOTSPACE:cs_query}|-) %{NUMBER:src_port} %{NOTSPACE:cs_username} %{IP:clientip} %{NOTSPACE:cs_useragent} %{NOTSPACE:cs_referer} %{NUMBER:sc_status} %{NUMBER:sc_subresponse} %{NUMBER:sc_win32_status} %{NUMBER:timetaken}"
input {
    tcp {
        port => 9900
        type => "iis"
    }
}

filter {
    if [type] == "iis" {
        if [message] =~ "^#" {
            drop {}
        }

        grok {
            match => {
                 message => "%{TIMESTAMP_ISO8601:logtime} %{IPORHOST:hostname} %{URIPROTO:cs_method} %{URIPATH:cs_stem} (?:%{NOTSPACE:cs_query}|-) %{NUMBER:src_port} %{NOTSPACE:cs_username} %{IP:clientip} %{NOTSPACE:cs_useragent} %{NOTSPACE:cs_referer} %{NUMBER:sc_status} %{NUMBER:sc_subresponse} %{NUMBER:sc_win32_status} %{NUMBER:timetaken}"
            }
        }
    }
}

output {
    stdout { }
}
테스트를 해보면,
C:\logstash\config> type test.log | netcat localhost 9900
정상 동작하는 것을 볼 수 있습니다.
{
               "port" => 54505,
         "@timestamp" => 2020-09-06T06:49:14.428Z,
               "host" => "0:0:0:0:0:0:0:1",
               "type" => "iis",
          "timetaken" => "9744",
         "cs_referer" => "-",
            "cs_stem" => "/WCFs/TestCall.svc",
           "src_port" => "80",
    "sc_win32_status" => "0",
           "cs_query" => "-",
           "clientip" => "127.0.0.1",
           "hostname" => "127.0.0.1",
        "cs_username" => "-",
          "cs_method" => "GET",
           "@version" => "1",
          "sc_status" => "404",
       "cs_useragent" => "Mozilla/5.0+(Windows+NT+10.0;+WOW64;+Trident/7.0;+rv:11.0)+like+Gecko",
     "sc_subresponse" => "0",
            "logtime" => "2018-12-20 04:35:30",
            "message" => "2018-12-20 04:35:30 127.0.0.1 GET /WCFs/TestCall.svc - 80 - 127.0.0.1 Mozilla/5.0+(Windows+NT+10.0;+WOW64;+Trident/7.0;+rv:11.0)+like+Gecko - 404 0 0 9744\r"
}
{
               "port" => 54505,
         "@timestamp" => 2020-09-06T06:49:14.428Z,
               "host" => "0:0:0:0:0:0:0:1",
               "type" => "iis",
          "timetaken" => "18",
         "cs_referer" => "-",
            "cs_stem" => "/",
           "src_port" => "8010",
    "sc_win32_status" => "0",
           "cs_query" => "-",
           "clientip" => "::1",
           "hostname" => "::1",
        "cs_username" => "-",
          "cs_method" => "GET",
           "@version" => "1",
          "sc_status" => "200",
       "cs_useragent" => "Mozilla+(http://localhost:8010/.0)",
     "sc_subresponse" => "0",
            "logtime" => "2019-08-28 00:00:43",
            "message" => "2019-08-28 00:00:43 ::1 GET / - 8010 - ::1 Mozilla+(http://localhost:8010/.0) - 200 0 0 18\r"
}
결국, 여러분들의 IIS 출력 로그의 형식과 grok 패턴이 일치하는지 꼭 확인해야 합니다.
여기서 끝내면 조금 아쉬우니 ^^ 좀 더 다뤄보겠습니다. 가령, 여러분들이 원하는 것은 elasticsearch로 출력하는 것이고 저장소를 절약하기 위해 출력으로 "timetaken", "cs_referer", "cs_stem" 항목만 원한다고 가정해 보겠습니다. 그럼 파이프라인을 이렇게 변경해 주면 됩니다.
input {
    tcp {
        port => 9900
        type => "iis"
    }
}

filter {
    if [type] == "iis" {
        if [message] =~ "^#" {
            drop {}
        }

        grok {
            match => {
                message => "%{TIMESTAMP_ISO8601:logtime} %{IPORHOST:hostname} %{URIPROTO:cs_method} %{URIPATH:cs_stem} (?:%{NOTSPACE:cs_query}|-) %{NUMBER:src_port} %{NOTSPACE:cs_username} %{IP:clientip} %{NOTSPACE:cs_useragent} %{NOTSPACE:cs_referer} %{NUMBER:sc_status} %{NUMBER:sc_subresponse} %{NUMBER:sc_win32_status} %{NUMBER:timetaken}"
            }
        }

        mutate {
            remove_field => [ "logtime", "hostname", "cs_method", "cs_query",
                              "src_port", "cs_username", "clientip", "cs_useragent", "sc_status",
                              "sc_subresponse", "sc_win32_status",
                              "message"
                            ]
        }
    }
}

output {
    elasticsearch {
        hosts => ["localhost:9200"]
    }

    stdout { }
}
mutate + remove_field를 이용해 출력의 필드를 조정했고, 가공된 메시지에 대한 출력을 2군데(elasticsearch, stdout)로 조정했으니 이제 elasticsearch에도 저장이 되면서 콘솔에서도 결과를 확인할 수 있습니다.
{
          "port" => 54990,
    "@timestamp" => 2020-09-06T07:07:56.071Z,
          "host" => "0:0:0:0:0:0:0:1",
     "timetaken" => "18",
    "cs_referer" => "-",
       "cs_stem" => "/",
      "@version" => "1",
          "type" => "iis"
}
{
          "port" => 54990,
    "@timestamp" => 2020-09-06T07:07:56.071Z,
          "host" => "0:0:0:0:0:0:0:1",
     "timetaken" => "9744",
    "cs_referer" => "-",
       "cs_stem" => "/WCFs/TestCall.svc",
      "@version" => "1",
          "type" => "iis"
}
그런데, cs_referer의 경우 가만 보니 "NOTSPACE"보다는 "URI" 형식이 더 맞을 것 같습니다.
message => "%{TIMESTAMP_ISO8601:logtime} %{IPORHOST:hostname} %{URIPROTO:cs_method} %{URIPATH:cs_stem} (?:%{NOTSPACE:cs_query}|-) %{NUMBER:src_port} %{NOTSPACE:cs_username} %{IP:clientip} %{NOTSPACE:cs_useragent} %{URI:cs_referer} %{NUMBER:sc_status} %{NUMBER:sc_subresponse} %{NUMBER:sc_win32_status} %{NUMBER:timetaken}"
그런데 이렇게 바꾸고 나서 테스트하면 정상적인 동작을 안 합니다.
{
          "port" => 55207,
    "@timestamp" => 2020-09-06T07:30:39.424Z,
          "host" => "0:0:0:0:0:0:0:1",
      "@version" => "1",
          "tags" => [
        [0] "_grokparsefailure"
    ],
          "type" => "iis"
}

...[생략]...
왜냐하면, IIS 로그의 경우 referer(
referrer)가 없는 요청이면 '-' 문자가 들어오는데 "URI" 패턴에서는 이에 대한 배려가 없기 때문입니다. 이 문제를 수정하려면 마찬가지로 정규 표현식으로 대응해야 하는데,
(%{URI:cs_referer}|-)
문제는 해결했지만, 그렇게 했더니 이번엔 출력에서 해당 필드가 아예 사라집니다.
{
          "port" => 55286,
    "@timestamp" => 2020-09-06T07:34:25.708Z,
          "host" => "0:0:0:0:0:0:0:1",
     "timetaken" => "18",
       "cs_stem" => "/",
      "@version" => "1",
          "type" => "iis"
}
만약 '-' 문자가 있어도 필드를 유지하고 싶다면 별도의 grok 패턴을 담은 파일을 생성하고,
# mypattern.txt

URIWITHDASH %{URI}|-
"patterns_dir" 설정으로 파일이 놓인 디렉터리 경로를 연결한 후, 사용자 정의 패턴을 사용하면 됩니다.
input { ... }

filter {
    if [type] == "iis" {
        if [message] =~ "^#" {
            drop {}
        }

        grok {
            patterns_dir => [ "C:\logstash\grok_patterns" ]
            match => {
                message => "...[생략]... %{NOTSPACE:cs_useragent} %{URIWITHDASH:cs_referer} %{NUMBER:sc_status} %{NUMBER:sc_subresponse} %{NUMBER:sc_win32_status} %{NUMBER:timetaken}"
            }
        }

        mutate {
            remove_field => [ "logtime", "hostname", "cs_method", "cs_query",
                              "src_port", "cs_username", "clientip", "cs_useragent", "sc_status",
                              "sc_subresponse", "sc_win32_status",
                              "message"
                            ]
        }
    }
}

output { ... }
원하는 데로 출력되는 것을 확인하고.
{
          "port" => 56098,
    "@timestamp" => 2020-09-06T08:54:47.900Z,
          "host" => "127.0.0.1",
     "timetaken" => "9744",
    "cs_referer" => "-",
       "cs_stem" => "/WCFs/TestCall.svc",
      "@version" => "1",
          "type" => "iis"
}
Logstash의 웹 서버 로그 예제들을 보면 종종 geoip 설정이 있는데,
input { ... }

filter {
    if [message] =~ "^#" {
        drop {}
    }

    grok {
        match => {
                message => "...[생략]..."
        }
    }

    geoip {
        source => "clientip"
        fields => ["city_name", "country_name", "location", "region_name"]
    }
}

output { ... }
실제로 해보면 _geoip_lookup_failure 오류가 발생하는 경우가 있습니다.
{
    ...[생략]...
    "tags" => [
    [0] "_geoip_lookup_failure"
    ],
    ...[생략]...
}
왜냐하면 geoip는
public ip에 대해서만 지역 정보를 알 수 있기 때문입니다.
만약 이런 식으로 오류가 발생하는 로그의 경우 output에 보내고 싶지 않다면 drop 시키는 방법도 있으니 참고하시고.
if "_geoip_lookup_failure" in [tags] {
    drop { }
}
grok 패턴을 이런 식으로 logstash를 이용해 매번 테스트하는 것도 때로는 번거로울 수 있습니다. 그런 경우라면 Grok Debugger 사이트를 이용해 보시면 좋은데요,
Grok Debugger
; http://grokdebug.herokuapp.com/
예를 들어, IIS 로그의 경우 "Input" 상자에 로그 내용을 복사한 다음, "Pattern"에 그것을 파싱할 수 있는 패턴 문자열을 넣어 실시간으로 테스트하는 것이 가능합니다. 게다가 사용자 정의 패턴도 등록하는 것이 가능한데, 아래의 그림과 같이 "Add custom patterns" 체크 버튼을 눌러 펼쳐지는 텍스트 박스 영역에 별도의 패턴을 등록하는 식으로 진행할 수 있습니다.
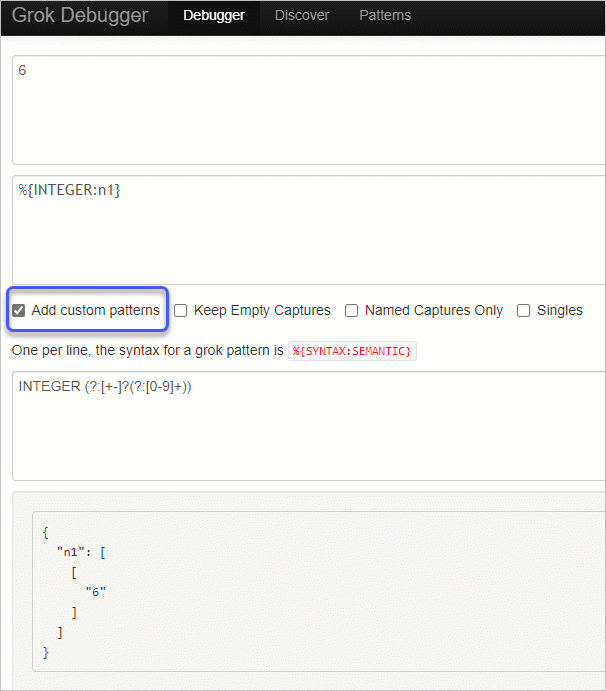
Input: 6
Pattern: %{INTEGER:n1}
Custom patterns: INTEGER (?:[+-]?(?:[0-9]+))
Output:
{
  "n1": [
    [
      "6"
    ]
  ]
}
참고로, Grok Debugger 사용 시 패턴 문자열 마지막에 "Enter" 키를 입력해 개행을 추가하지 않도록 주의해야 합니다. 그런 경우 분명히 올바른 패턴인데도 "No Matches" 결과가 나오므로!
[이 글에 대해서 여러분들과 의견을 공유하고 싶습니다. 틀리거나 미흡한 부분 또는 의문 사항이 있으시면 언제든 댓글 남겨주십시오.]