Custom Sources를 이용한 Azure Monitor Metric 만들기
Azure Monitor라는 서비스가 있습니다.
Azure Monitor
; https://azure.microsoft.com/en-us/services/monitor/#overview
소개 페이지에 있는 다음의 그림 하나가 모든 걸 설명해주는데요,
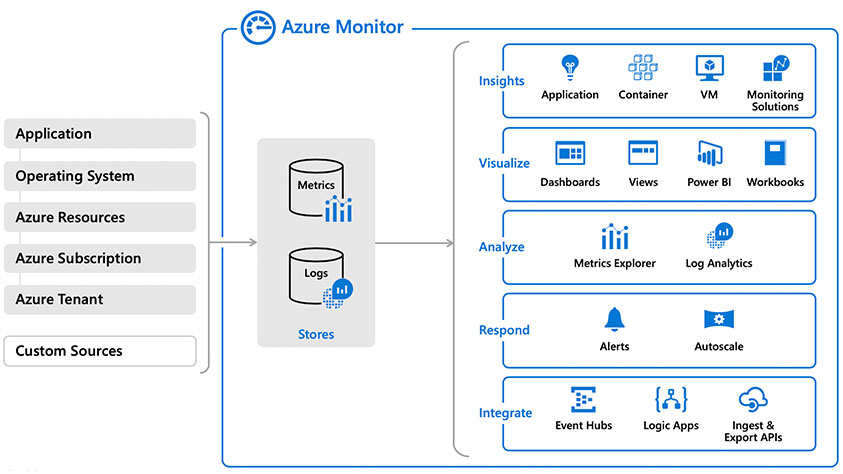
기본적으로 Azure 내에서의 다양한 서비스들에 대한 로그를 취합해 대시보드에 띄우거나, 분석, 알람 등의 서비스를 제공합니다. 그리고 그런 경우라면 대부분 그냥 버튼 클릭 몇 번으로 구성할 수 있습니다. 반면, 여기서 흥미로운 것은 외부의 사용자 데이터(Custom Sources)도 Azure Monitor에 통합시킬 수 있다는 점입니다. 이번 글에서는 이에 대한 내용을 다뤄보겠습니다. ^^
사용자 로그를 취합해 보여준다는 것은, 기본적으로 다음의 기능이 제공되어야 합니다.
- 사용자 로그 취합을 위한 Endpoint 제공
- 로그 Filtering
- 대시보드에 시각화
Azure Monitor라고 해서 딱히 별다른 수가 있겠습니까? ^^ 어쩔 수 없이 저 절차를 따라야 하는데요, Azure에서는 이렇게 순서를 잡을 수 있습니다.
- (Azure 측) 로그 취합을 위한 Endpoint를 제공하는 Log Analytics workspaces 생성
- (사용자 측) 로그를 생성해 REST API로 1번에서 생성한 workspace로 전달
- (Azure 측) KQL을 사용해 로그 필터링 및 대시보드에 구성할 뷰 확인
- (Azure 측) 대시보드에 로그 뷰 추가
자, 그럼 하나씩 알아볼까요? ^^
우선, 순서에도 나오듯이 Auzre 측에 로그 수집을 위한 "Log Analytics workspaces"를 하나 만들어야 합니다.
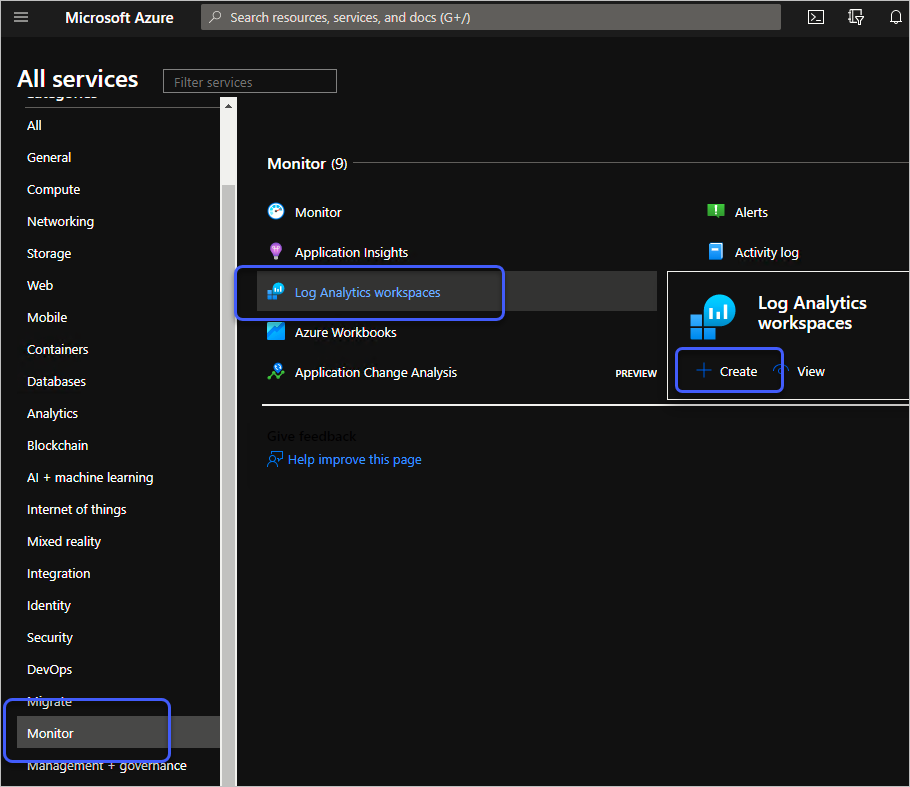
생성하면 다음과 같은 식의 서비스가 하나 추가되는데,
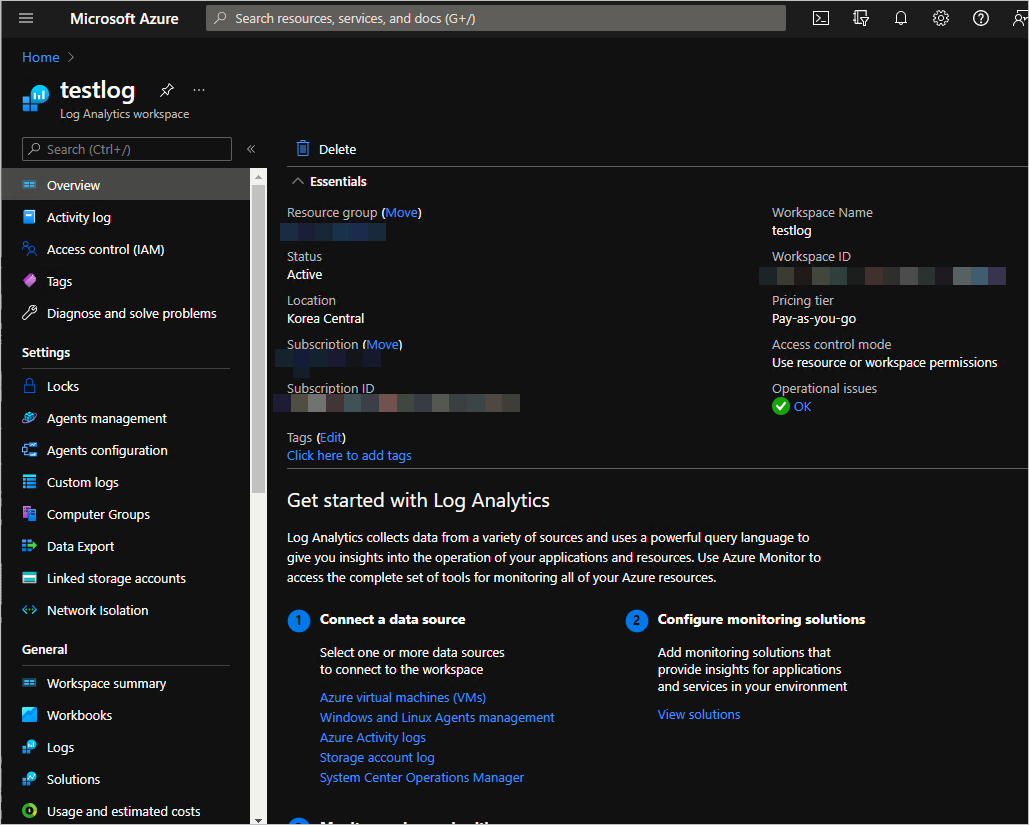
사용자 정의 로그 데이터를 보내기 위해서는 당연히 API Key 등의 값을 알아야 하므로 "Agents management" 메뉴를 선택, 다음과 같이 "Workspace ID", "Primary key"와 "Secondary key"를 보여주는데, 이 값들(Workspace ID와 key 한 개)을 기록해 둡니다.
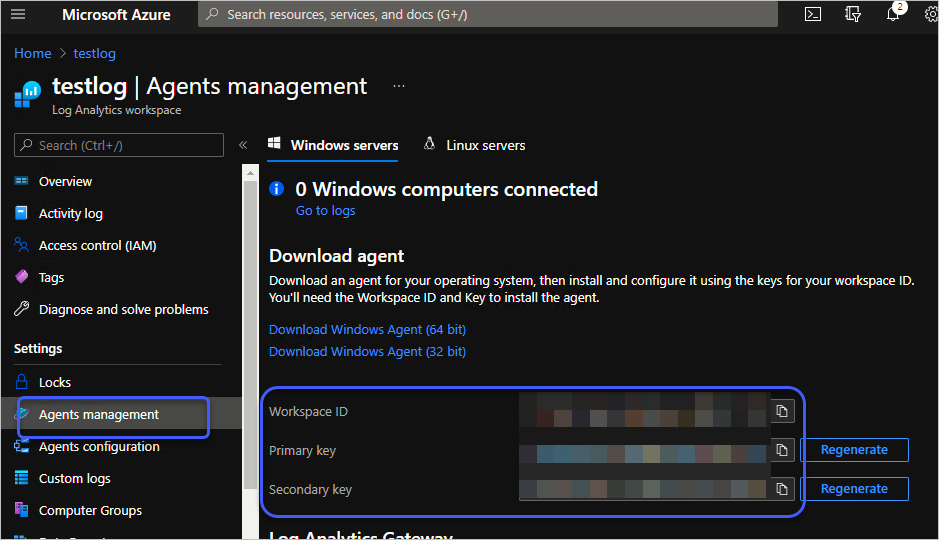
참고로, 위의 화면을 보면 "Windows servers"와 "Linux servers" 칼럼이 있고 그에 따라 "Download ... Agent" 링크가 있는데 기본적으로 "Windows event logs", "Windows performance counters", "Linux performance counters"에 대해 수집하는 에이전트가 제공됩니다. 하지만, 우리가 하고 싶은 것은 "사용자 정의 로그 데이터"를 보내는 것이므로 이번 글에서는 다루지 않습니다. ^^
자, 그럼 로그 데이터를 어떻게 보낼까요? Azure Monitor의 경우 "Custom sources"를 살펴 보면 다음과 같은 문구가 나옵니다.
Azure Monitor can collect log data from any REST client using
the Data Collector API. This allows you to create custom monitoring scenarios and extend monitoring to resources that don't expose telemetry through other sources.
결국 REST API를 제공한다는 건데요,
Send log data to Azure Monitor by using the HTTP Data Collector API (preview)
; https://docs.microsoft.com/en-us/azure/azure-monitor/logs/data-collector-api
아직 Preview 버전이지만 다행히 "public preview" 상태라 현재 테스트를 하는 데에는 문제가 없습니다. 세부적인 API 스펙은 문서를 참조하시고, 일단 C#으로 코드를 작성해 보면 이렇게 됩니다.
// 이 예제는 Python, PowerShell, Java 언어로도 아래의 링크에서 제공됩니다.
// https://docs.microsoft.com/en-us/azure/azure-monitor/logs/data-collector-api#sample-requests

using System.Net.Http.Headers;
using System.Security.Cryptography;
using System.Text;

public class Program
{
    public static void Main(string[] args)
    {
        (string customerId, string sharedKey) = GetKeyInfo();

        string jsonData = @"
[{""DemoField1"":""DemoValue1"",""DemoField2"":""DemoValue2""},{""DemoField3"":""DemoValue3"",""DemoField4"":""DemoValue4""}]
";
        // You can use an optional field to specify the timestamp from the data. If the time field is not specified, Azure Monitor assumes the time is the message ingestion time
        string timeStampField = "";

        string logName = "mydata";
        string datestring = DateTime.UtcNow.ToString("r");

        string signature = GetSignature(customerId, sharedKey, datestring, jsonData);

        PostData(customerId, logName, signature, datestring, jsonData, timeStampField);
    }

    public static void PostData(string customerId, string logName, string signature, string date, string json, string timestamp)
    {
        try
        {
            string url = "https://" + customerId + ".ods.opinsights.azure.com/api/logs?api-version=2016-04-01";

            System.Net.Http.HttpClient client = new System.Net.Http.HttpClient();
            client.DefaultRequestHeaders.Add("Accept", "application/json");
            client.DefaultRequestHeaders.Add("Log-Type", logName);
            client.DefaultRequestHeaders.Add("Authorization", signature);
            client.DefaultRequestHeaders.Add("x-ms-date", date);
            client.DefaultRequestHeaders.Add("time-generated-field", timestamp);

            System.Net.Http.HttpContent httpContent = new StringContent(json, Encoding.UTF8);
            httpContent.Headers.ContentType = new MediaTypeHeaderValue("application/json");
            Task<System.Net.Http.HttpResponseMessage> response = client.PostAsync(new Uri(url), httpContent);

            Console.WriteLine("Return Result: " + response.Result);
        }
        catch (Exception excep)
        {
            Console.WriteLine("API Post Exception: " + excep.Message);
        }
    }

    static string GetSignature(string customerId, string sharedKey, string datestring, string jsonData)
    {
        var jsonBytes = Encoding.UTF8.GetBytes(jsonData);
        string stringToHash = "POST\n" + jsonBytes.Length + "\napplication/json\n" + "x-ms-date:" + datestring + "\n/api/logs";
        string hashedString = BuildSignature(stringToHash, sharedKey);
        return "SharedKey " + customerId + ":" + hashedString;
    }

    static string BuildSignature(string message, string secret)
    {
        var encoding = new System.Text.ASCIIEncoding();
        byte[] keyByte = Convert.FromBase64String(secret);
        byte[] messageBytes = encoding.GetBytes(message);
        using (var hmacsha256 = new HMACSHA256(keyByte))
        {
            byte[] hash = hmacsha256.ComputeHash(messageBytes);
            return Convert.ToBase64String(hash);
        }
    }

    static (string customerId /* workspaceId */, string sharedKey) GetKeyInfo()
    {
        return ("...workspace id...", "...primary key or secondary key...");
    }
}

/* 정상적인 경우 출력 결과
Return Result: StatusCode: 200, ReasonPhrase: 'OK', Version: 1.1, Content: System.Net.Http.HttpConnectionResponseContent, Headers:
{
  Cache-Control: private
  Server: Microsoft-IIS/10.0
  X-AspNet-Version: 4.0.30319
  X-Powered-By: ASP.NET
  Strict-Transport-Security: max-age=31536000; includeSubDomains
  Date: Mon, 14 Nov 2021 06:51:45 GMT
  Content-Length: 0
}
*/
대부분의 코드는 그냥 이용하면 되므로, 오직 신경 써야 할 것은 데이터의 구성입니다. 위의 코드에서는 "mydata"라는 식별자로 2개 분류로 나눈 데이터를 전송하는 것을 보여주고 있습니다.
[
    {
        "DemoField1":"DemoValue1",
        "DemoField2":"DemoValue2"
    },
    {
        "DemoField3":"DemoValue3",
        "DemoField4":"DemoValue4"
    }
]
어렵지 않죠? ^^
자, 그럼 이제 실제로 데이터가 잘 전송이 되고 있는지 서버에서 확인해봐야 합니다.
이전에 생성해 두었던 Azure Portal의 Log Analytics workspace로 들어가 "General" / "Logs" 메뉴를 선택하면 아래와 같이 "New Query 1" 탭이 뜨면서 그것의 좌측 부분에 "Custom Logs" 트리를 통해 사용자가 전송한 데이터의 구성을 확인할 수 있고,
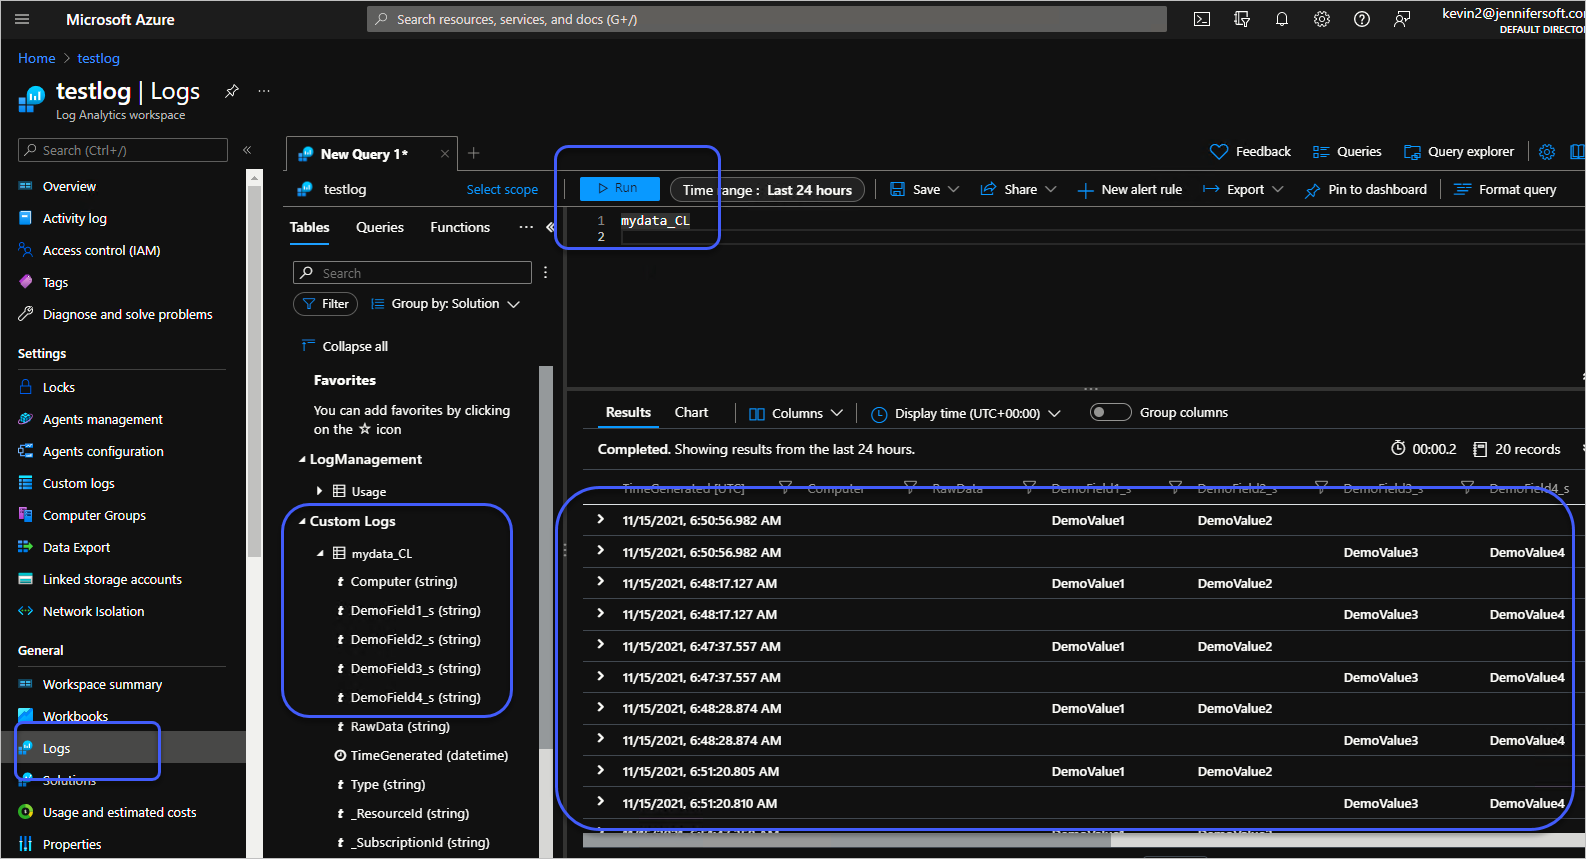
우측 패널에서는 (마치 SQL의 사용자 경험에 따라) 사용자가 원하는 데이터를 쿼리로 작성/실행해 볼 수 있습니다. 위의 화면에서는 단순히 "mydata_CL"이라고 이름만 넣어 "Run"을 했는데 아래의 문서를 보면,
Kusto 쿼리 개요
; https://docs.microsoft.com/ko-kr/azure/data-explorer/kusto/query/

Samples for Kusto Queries
; https://docs.microsoft.com/en-us/azure/data-explorer/kusto/query/samples?pivots=azuredataexplorer
KQL(Kusto Query Language)을 통해 더욱 풍부한 필터링 기능을 제공하는 것을 확인할 수 있습니다.
sql 쿼리와는 양식이 좀 다르지만, 익숙한 파이프(|) 기호를 사용하므로 어렵지 않게 구성할 수 있습니다. 가령, "DemoField1_s"의 칼럼 값이 "DemoValue1"을 갖는 행의 수를 다음과 같이 조회할 수 있습니다.
mydata_CL
| where DemoField1_s == "DemoValue1"
| count
처음 접하는 경우 얼핏 막막해 보일 수 있지만, Azure Portal의 에디터 화면에서 타이핑을 하는 경우 IntelliSense가 제공되기 때문에 생각보다 어렵지 않게 작성할 수 있습니다. ^^ (게다가
"Kusto 쿼리 개요" 문서에도 아주 자세하게 설명을 하고 있고.)
참고로, 수집이 "실시간"으로 되는 것은 아니기 때문에 로그를 보낸 다음 약간의 (수 초 ~ 수십 초) 시간이 지난 후 쿼리를 수행해야 결과가 나옵니다.
자, 이제 중요한 것은 저렇게 보낸 로그 데이터를 화면에 보여주는 것인데요, 사실 위의 예제에 쓴 데이터는 딱히 어떤 것을 보여줄 만한 내용은 아니므로 좀 더 현실적으로 CPU 사용량을 남기도록 바꿔보겠습니다.
public static void Main(string[] args)
{
    (string customerId, string sharedKey) = GetKeyInfo();

    string timeStampField = "";

    string logName = $"mypc";

    while (true)
    {
        ulong cpuUsage = GetCpuUsage();
        string jsonData = @"[{""cpu"":" + cpuUsage + "}]";

        string datestring = DateTime.UtcNow.ToString("r");
        string signature = GetSignature(customerId, sharedKey, datestring, jsonData);

        PostData(customerId, logName, signature, datestring, jsonData, timeStampField);
        Thread.Sleep(1000);
    }
}

// WMI는 다소 무거운 코드이므로, 남의 집에 얹혀사는 모니터링같은 서비스는 쥐 죽은 듯이 활동해야 하기 때문에,
// 다음의 글에 소개하는 Win32 API를 직접 Interop하는 것이 더 권장됩니다.
//
// C# - 시스템의 CPU 사용량 및 프로세스(EXE)의 CPU 사용량 알아내는 방법
// ; https://www.sysnet.pe.kr/2/0/1684
static ulong GetCpuUsage()
{
    ManagementObjectSearcher searcher = new ManagementObjectSearcher("select * from Win32_PerfFormattedData_PerfOS_Processor");
    foreach (ManagementObject obj in searcher.Get())
    {
        var result = obj["PercentProcessorTime"];
        return (ulong)result;
    }

    return 0;
}
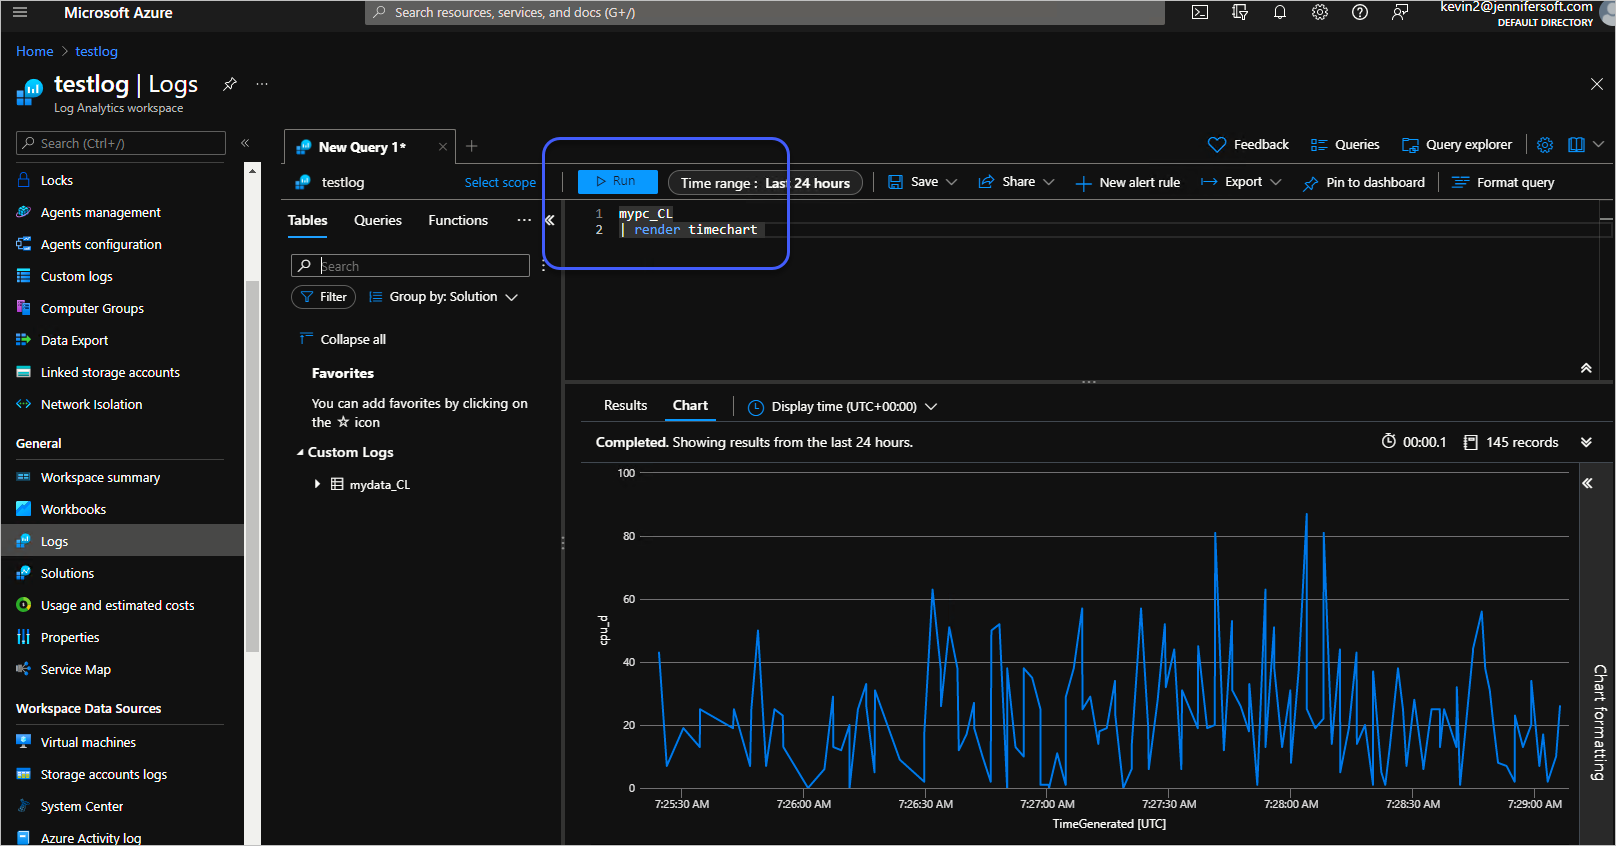
그럼 "General" / "Logs"에서 Kusto 쿼리를 이용해 다음과 같이 시각화 표현과 함께 확인할 수 있습니다.
mypc_CL
| render timechart
예제 데이터가 구성되었으니, 이제 화면에 보여줘야 하는데요, 이것은 다음의 문서에서 다룹니다.
Log Analytics 데이터의 대시보드 만들기 및 공유
; https://docs.microsoft.com/ko-kr/azure/azure-monitor/visualize/tutorial-logs-dashboards
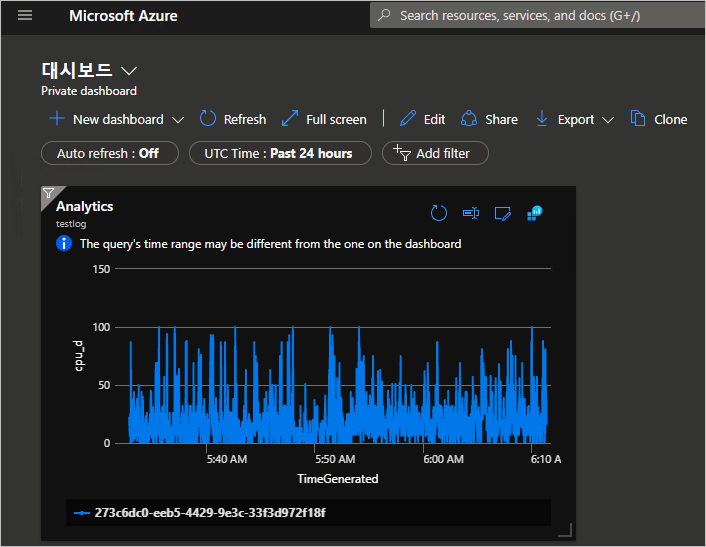
그러니까, Azure Monitor라는 제품군에 별도의 대시보드가 있지는 않고 Azure Portal 자체의 사용자 정의 Dashboard에 구성할 수 있기 때문에 전체적인 내용은 지난번에 소개한 글의 내용을 따릅니다.
Azure - 원하는 성능 데이터로 모니터링 대시보드 구성
; https://www.sysnet.pe.kr/2/0/11521
따라서, "New dashboard"를 하나 구성해 두고, 이전의 KQL 화면에서 "지난 1시간 동안의 CPU 사용량"을 쿼리해 본 후,
mypc_CL
| where TimeGenerated > ago(1h)
| render timechart
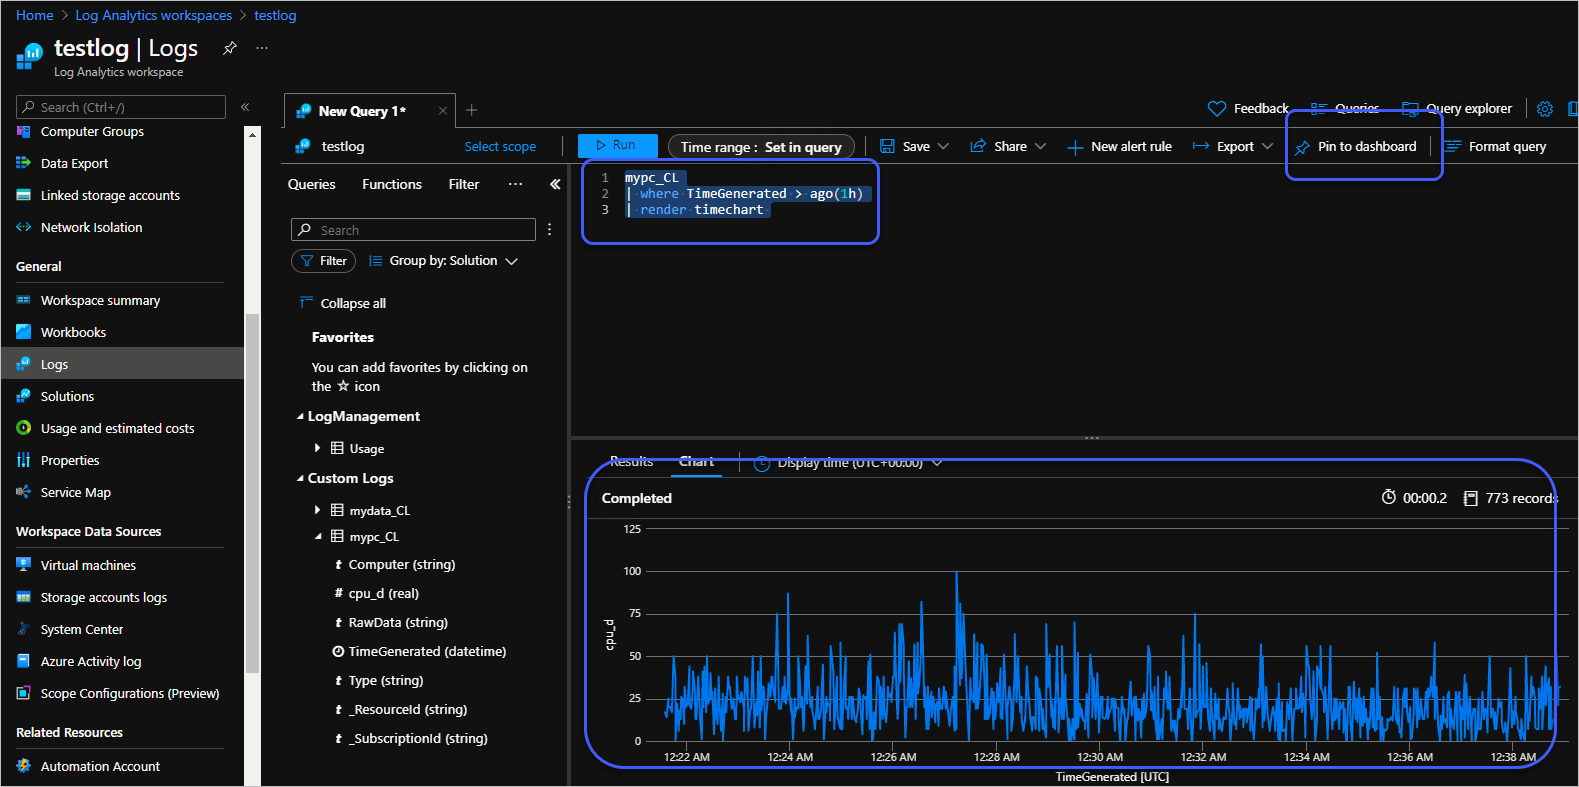
우측 상단의 "Pin to dashboard"를 선택해 현재 쿼리한 결과 화면을 대시보드에 나오게 할 수 있습니다.
끝이군요, 이후의 응용은 여러분들의 사이트 특성에 맞게 하시면 되겠고. ^^
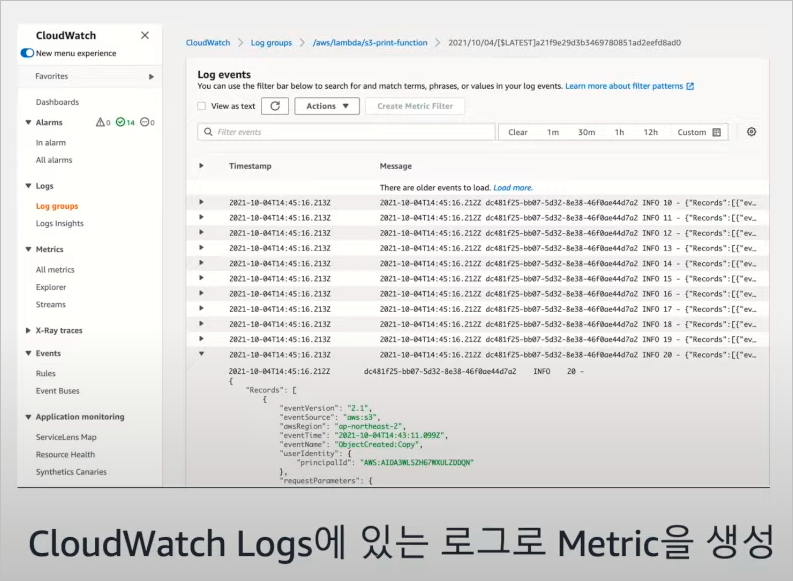
며칠 전, 아마존에서 제공하는 CloudWatch 동영상을 봤는데요,
다양한 로그 데이터를 통해 Amazon CloudWatch Metric 만들기
: https://www.youtube.com/watch?v=f2b3QdNEOwI
간단하게 설명하면, CloudWatch Log Agent, Fluent Bit 등의 도구를 이용해 Amazone CloudWatch에 보내면,
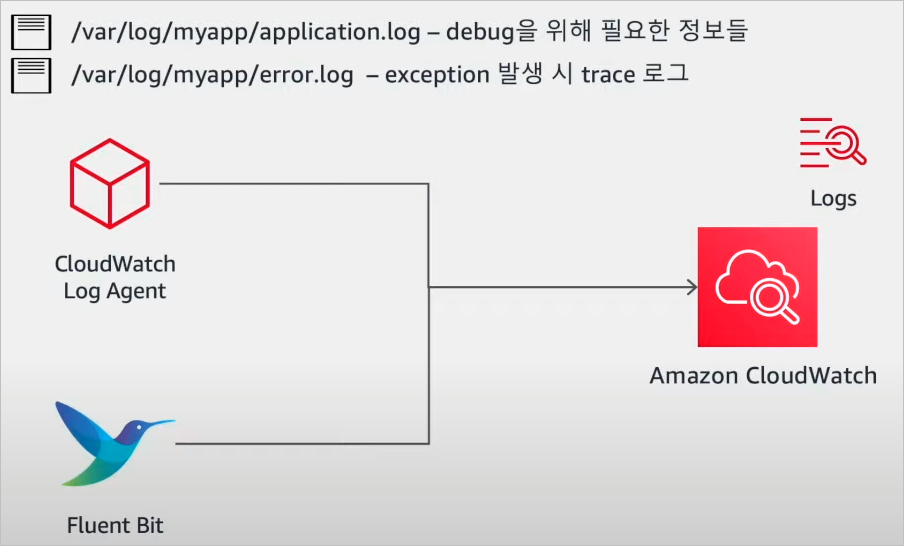
UI를 제공해 쉬운 모니터링 서비스를 제공하는 서비스입니다.
그럼 Azure에도 있지 않을까요? ^^ 그래서 살펴보니,
AWS와 Azure 서비스 비교
; https://docs.microsoft.com/ko-kr/azure/architecture/aws-professional/services
발견하게 바로 오늘 글의 내용이었습니다.
[이 글에 대해서 여러분들과 의견을 공유하고 싶습니다. 틀리거나 미흡한 부분 또는 의문 사항이 있으시면 언제든 댓글 남겨주십시오.]