C# - 시스템의 CPU 사용량 및 프로세스(EXE)의 CPU 사용량 알아내는 방법
CPU 사용률을 C#으로 알아내는 방법을 검색해 보면, 거의 WMI를 이용한 방법만을 소개하는 경우가 많습니다. 물론, WMI가 간편하긴 하지만 부하(overhead)를 고려한다면 다른 방법을 찾는 것이 좋습니다. 당연히 ^^ Win32 API가 훨씬 가볍겠지요.
Determine CPU usage of current process (C++ and C#)
; http://www.philosophicalgeek.com/2009/01/03/determine-cpu-usage-of-current-process-c-and-c/comment-page-1/
위의 소스코드와 같이
GetSystemTimes Win32 API를 이용해서,
[System.Runtime.InteropServices.DllImport("kernel32.dll", SetLastError = true)]
static extern bool GetSystemTimes(out FILETIME lpIdleTime,
            out FILETIME lpKernelTime, out FILETIME lpUserTime);
다음과 같이 호출해 주면 됩니다.
FILETIME sysIdle, sysKernel, sysUser;
GetSystemTimes(out sysIdle, out sysKernel, out sysUser);
이때 Kernel에는 Idle 시간이 포함되어 있기 때문에 각 영역별로는 이런 식으로 셈을 해줘야 합니다.
// GetSystemTimes에서 반환받은 FILETIME 구조체의 값을 ulong으로 변환
// ulong uKernel = 변환(sysKernel);
// ulong uUser = 변환(sysUser);
// ulong uIdle = 변환(sysIdle);

ulong sysTotal = uKernel + uUser;
long kernelTotal = (long)(uKernel - uIdle);
그런데, GetSystemTimes가 반환하는 시간은 CPU 사용률이 아닙니다. 대신 CPU가 해당 모드에서 소비된 100 나노초 단위의 시간이기 때문에 이것 자체로는 (시스템이 부팅된 이후) 현재까지의 CPU 사용률에 대한 평균을 구하는 의미밖에 없습니다. 즉, 우리가 알고 싶은 것은 작업관리자에서처럼 초마다 변화하는 CPU 사용률이기 때문에 여기서 한가지 더 작업을 해야 합니다.
따라서, 최초에 한번 GetSystemTimes로 시간을 구해 보존한 다음, 이후 시간이 흘러 한번 더 GetSystemTimes을 호출해 각각의 모드에 소비된 시간의 차를 구하는 방식을 사용합니다. 그래서 코드가 아래와 같이 바뀝니다.
using System.Runtime.InteropServices.ComTypes;

class CpuUsage
{
    [System.Runtime.InteropServices.DllImport("kernel32.dll", SetLastError = true)]
    static extern bool GetSystemTimes(out FILETIME lpIdleTime,
                out FILETIME lpKernelTime, out FILETIME lpUserTime);

    FILETIME _prevSysKernel;
    FILETIME _prevSysUser;
    FILETIME _prevSysIdle;

    public void GetUsage(out float processorCpuUsage)
    {
        processorCpuUsage = 0.0f;

        FILETIME sysIdle, sysKernel, sysUser;

        if (!GetSystemTimes(out sysIdle, out sysKernel, out sysUser))
        {
            return 0.0f;
        }

        if (_prevSysIdle.dwLowDateTime != 0 && _prevSysIdle.dwHighDateTime != 0)
        {
            ulong sysKernelDiff = SubtractTimes(sysKernel, _prevSysKernel);
            ulong sysUserDiff = SubtractTimes(sysUser, _prevSysUser);
            ulong sysIdleDiff = SubtractTimes(sysIdle, _prevSysIdle);

            ulong sysTotal = sysKernelDiff + sysUserDiff;
            long kernelTotal = (long)(sysKernelDiff - sysIdleDiff);

            processorCpuUsage = (float)((((ulong)kernelTotal + sysUserDiff) * 100.0) / sysTotal);
        }

        _prevSysKernel = sysKernel;
        _prevSysUser = sysUser;
        _prevSysIdle = sysIdle;
    }

    private UInt64 SubtractTimes(FILETIME a, FILETIME b)
    {
        ulong aInt = ((ulong)a.dwHighDateTime << 32) | (ulong)a.dwLowDateTime;
        ulong bInt = ((ulong)b.dwHighDateTime << 32) | (ulong)b.dwLowDateTime;

        return aInt - bInt;
    }
}
간혹 가다가 다른 소스코드를 보면 구해진 (100 나노초 단위의) FILETIME 시간을 10,000으로 나눠서 밀리초로 구한 다음 100분율로 변환하는 것을 볼 수 있는데요. 쓸모없는 과정입니다. CPU 사용률을 구하는 경우라면 굳이 밀리초로 변환할 필요가 없습니다.
그런데, 위의 코드를 실제로 실행해 보면 약간의 문제가 있는 것을 볼 수 있습니다. 문제의 발단은 SubtractTime 내의 코드에 있는데요.
(ulong)a.dwLowDateTime
(ulong)b.dwLowDateTime
System.Runtime.InteropServices.ComTypes.FILETIME 정의를 보면,
using System;
using System.Runtime.InteropServices;

[StructLayout(LayoutKind.Sequential)]
public struct FILETIME
{
    public int dwLowDateTime;
    public int dwHighDateTime;
}
보시다시피 dwLowDateTime 형식이 부호 있는 정수형(Int32)입니다. 만약 이 값이 음수(-)인 경우가 발생하면 ulong으로 형변환을 하는 경우 음수 비트가 확장되어 dwHighDateTime과의 OR 연산 결과값이 틀어져버립니다. 이런 부작용을 막고 싶다면 ulong이 아닌 uint로 형변환을 낮춰야 합니다.
private UInt64 SubtractTimes(FILETIME a, FILETIME b)
{
    ulong aInt = ((ulong)a.dwHighDateTime << 32) | (uint)a.dwLowDateTime;
    ulong bInt = ((ulong)b.dwHighDateTime << 32) | (uint)b.dwLowDateTime;

    return aInt - bInt;
}
또는, 부호없는 정수를 사용하는 FILETIME을 사용하도록 구조체를 아예 교체하는 것도 방법이 될 수 있습니다.
[System.Runtime.InteropServices.StructLayout(System.Runtime.InteropServices.LayoutKind.Sequential)]
public struct FILETIME
{
    public uint dwLowDateTime;
    public uint dwHighDateTime;
}
그런데, 실행하다 보면 여전히 얼토당토않는 수치가 나오는 경우를 볼 수 있습니다. 가만 보니, kernel 시간에서 idle 시간을 뺀 값이 음수(-)인 경우가 있습니다. 예를 들어, 다음과 같은 수치가 나오는 것입니다.
kernel 7984
idle 7985
참... 뭐라 할 말이 없군요. ^^ idle 시간이 kernel 시간에 포함되는 것인데 그것이 음수가 나오다니요? 생각해 볼 수 있는 가능성이라고는 GetSystemTimes 내부에서 CPU 시간에 대한 스냅샷을 뜰 때 kernel 시간을 구한 후 미묘하게 100 나노초 후에 idle 시간이 구해지는 경우가 아닌가 싶습니다.
어쨌든, 이런 수치가 나올 때가 있으므로 이에 대한 보정이 필요합니다.
long kernelTotal = (long)(sysKernelDiff - sysIdleDiff);

if (kernelTotal < 0)
{
    kernelTotal = 0;
}
여기까지 구했으면 완벽합니다. ^^
기왕 구하는 거 해당 프로세스(EXE)의 CPU 사용률도 구해보는 것도 좋겠지요? ^^ 방법은 동일하게 EXE에 소비된 CPU 시간(100나노초)을 한번 구해두고 이후로 그 차이 값을 구하면 해당 시간 동안 소비된 CPU 시간이 나옵니다. 그 후, 전체 CPU 시간으로 나누면 해당 프로세스에 할당된 CPU 소비량을 알 수 있게 됩니다.
다행히 프로세스의 CPU 시간은 Win32 API를 이용할 필요가 없고 Process 타입의 TotalProcessorTime 값을 사용하면 됩니다. 이것이 모두 반영된 소스코드를 아래에 실었으니 참고하세요. ^^
using System;
using System.Diagnostics;
using System.Runtime.InteropServices.ComTypes;

namespace CpuUsageCs
{
    class CpuUsage
    {
        [System.Runtime.InteropServices.DllImport("kernel32.dll", SetLastError = true)]
        static extern bool GetSystemTimes(out FILETIME lpIdleTime,
                    out FILETIME lpKernelTime, out FILETIME lpUserTime);

        FILETIME _prevSysKernel;
        FILETIME _prevSysUser;
        FILETIME _prevSysIdle;

        TimeSpan _prevProcTotal;

        public CpuUsage()
        {
            _prevProcTotal = TimeSpan.MinValue;
        }

        public float GetUsage(out float processorCpuUsage)
        {
            processorCpuUsage = 0.0f;

            float _processCpuUsage = 0.0f;
            FILETIME sysIdle, sysKernel, sysUser;

            Process process = Process.GetCurrentProcess();
            TimeSpan procTime = process.TotalProcessorTime;

            if (!GetSystemTimes(out sysIdle, out sysKernel, out sysUser))
            {
                return 0.0f;
            }

            if (_prevProcTotal != TimeSpan.MinValue)
            {
                ulong sysKernelDiff = SubtractTimes(sysKernel, _prevSysKernel);
                ulong sysUserDiff = SubtractTimes(sysUser, _prevSysUser);
                ulong sysIdleDiff = SubtractTimes(sysIdle, _prevSysIdle);

                ulong sysTotal = sysKernelDiff + sysUserDiff;
                long kernelTotal = (long)(sysKernelDiff - sysIdleDiff);

                if (kernelTotal < 0)
                {
                    kernelTotal = 0;
                }

                processorCpuUsage = (float)((((ulong)kernelTotal + sysUserDiff) * 100.0) / sysTotal);

                long procTotal = (procTime.Ticks - _prevProcTotal.Ticks);

                if (sysTotal > 0)
                {
                    _processCpuUsage = (short)((100.0 * procTotal) / sysTotal);
                }
            }

            _prevProcTotal = procTime;
            _prevSysKernel = sysKernel;
            _prevSysUser = sysUser;
            _prevSysIdle = sysIdle;

            return _processCpuUsage;
        }

        private UInt64 SubtractTimes(FILETIME a, FILETIME b)
        {
            ulong aInt = ((ulong)a.dwHighDateTime << 32) | (uint)a.dwLowDateTime;
            ulong bInt = ((ulong)b.dwHighDateTime << 32) | (uint)b.dwLowDateTime;

            return aInt - bInt;
        }
    }
}
사용법도 간단합니다.
while (true)
{
    float processorCpuUsage;
    float processCpuUsage = usage.GetUsage(out processorCpuUsage);
    Console.WriteLine("{0}% process usage, {1}% CPU", processCpuUsage, processorCpuUsage);
    Thread.Sleep(1000);
}
(
첨부한 소스코드에서 테스트를 해볼 수 있습니다.)
이번 테스트를 하면서 발견한 사실이 하나 있다면 (적어도 제가 테스트한 윈도우 8.1의 경우) 작업 관리자의 CPU 사용률과 성능모니터링 도구(Perfmon.msc)의 CPU 사용률이 같지 않다는 것입니다.
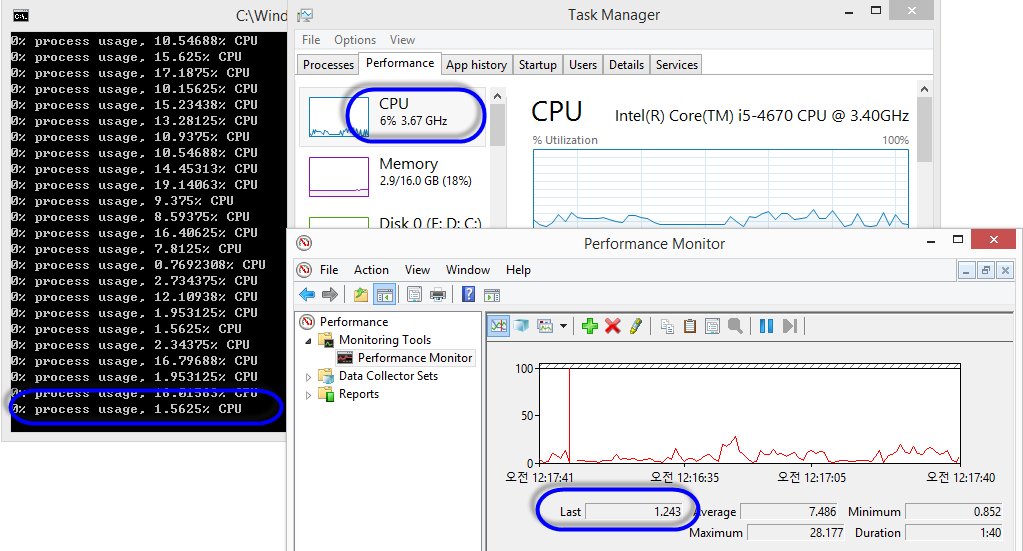
보시는 바와 같이 GetSystemTimes로 구한 CPU 사용률은 성능 모니터링 도구의 값과 거의 일치하는 반면 작업 관리자의 CPU 사용률과는 다릅니다. (처음에는 Hyper-V를 사용해서 그런 줄 알았는데, Hyper-V가 없는 경우에도 마찬가지 현상이 발생합니다.)
딱히 웹 검색을 해도 이에 대한 글이 발견되지는 않았습니다. 혹시 아시는 분은 ^^ 덧글 좀 부탁드립니다.
(2022-12-02: 업데이트) 작업 관리자와 성능 모니터링 도구의 수치는 각각 다음과 같이 정리할 수 있습니다.
성능 모니터링 도구를 띄웠을 때 보여주는 수치 == "Object == Processor Information"의 "% Processor Time (_Total)"
또한 이 값은 "Object == Processor"의 "%Processor Time (_Total)"과도 동일한 값입니다.

반면, 작업 관리자가 보여주는 값 == "Object == Processor Information"의 "% Processor Utility (_Total)"과 일치합니다.
따라서 성능 카운터의 설명을 빌리면,
"Object == Processor Information"의 "% Processor Time (_Total)"
% Processor Time is the percentage of elapsed time that the processor spends to execute a non-Idle thread. It is calculated by measuring the percentage of time that the processor spends executing the idle thread and then subtracting that value from 100%. (Each processor has an idle thread to which time is accumulated when no other threads are ready to run). This counter is the primary indicator of processor activity, and displays the average percentage of busy time observed during the sample interval. It should be noted that the accounting calculation of whether the processor is idle is performed at an internal sampling interval of the system clock tick. On todays fast processors, % Processor Time can therefore underestimate the processor utilization as the processor may be spending a lot of time servicing threads between the system clock sampling interval. Workload based timer applications are one example of applications which are more likely to be measured inaccurately as timers are signaled just after the sample is taken.
"Object == Processor"의 "%Processor Time (_Total)"
% Processor Time is the percentage of elapsed time that the processor spends to execute a non-Idle thread. It is calculated by measuring the percentage of time that the processor spends executing the idle thread and then subtracting that value from 100%. (Each processor has an idle thread that consumes cycles when no other threads are ready to run). This counter is the primary indicator of processor activity, and displays the average percentage of busy time observed during the sample interval. It should be noted that the accounting calculation of whether the processor is idle is performed at an internal sampling interval of the system clock (10ms). On todays fast processors, % Processor Time can therefore underestimate the processor utilization as the processor may be spending a lot of time servicing threads between the system clock sampling interval. Workload based timer applications are one example of applications which are more likely to be measured inaccurately as timers are signaled just after the sample is taken.
"Object == Processor Information"의 "% Processor Utility (_Total)"
Processor Utility is the amount of work a processor is completing, as a percentage of the amount of work the processor could complete if it were running at its nominal performance and never idle. On some processors, Processor Utility may exceed 100%.
이렇게 정리가 되는데, 자세히 보면 "Object == Processor Information"의 "% Processor Time (_Total)", "Object == Processor"의 "%Processor Time (_Total)"의 경우에도 설명이 살짝 다릅니다. (혹시, 저 현란한 영문장을 해석해 멋지게 설명해 주실 분 계실까요? ^^ 단어 하나하나 뜯어보면 매우 평이한 문장인데... ^^; 도대체가 눈에 들어오지 않는군요.)
[이 글에 대해서 여러분들과 의견을 공유하고 싶습니다. 틀리거나 미흡한 부분 또는 의문 사항이 있으시면 언제든 댓글 남겨주십시오.]