OpenCover 오픈 소스를 이용한 .NET 코드 커버리지(Code coverage)
지난 글에 이어,
C# Code Coverage 도구 - Semantic Designs 소개
; https://www.sysnet.pe.kr/2/0/2880
또 다른 code coverage 도구로 OpenCover를 소개해 보겠습니다.
Getting code coverage from your .NET testing using OpenCover.
; http://www.codeproject.com/Articles/677691/Getting-code-coverage-from-your-NET-testing-using
위의 글에 워낙 자세하게 설명이 되어 있어서 ^^; 사실 쓰기가 민망할 정도군요.
"
Getting code coverage from your .NET testing using OpenCover." 글에 나온 것처럼, github 커밋을 보면 4일 전의 기록이 있는 것으로 보아 살아 있는 프로젝트가 맞는 것 같습니다.
그럼, 한번 따라해 볼까요? ^^
우선, bitbucket에서 컴파일 된 바이너리를 zip 파일로 받습니다.
opencover.4.5.3207.zip
; https://bitbucket.org/shaunwilde/opencover/downloads/opencover.4.5.3207.zip
이전에 소개해 드린 Semantic Designs 제품은 소스 코드를 직접 변경하는 반면, OpenCover는 .NET Profiler 기법을 사용해 EXE 프로세스가 실행되면서 JIT 컴파일 시에 code-coverage 용 IL 코드를 추가해 변경시켜 실행하는 제품입니다.
예제로 테스트를 직접 해보면 더 이해가 빠르겠지요? ^^ 간단하게 if 문과 메서드를 추가한 콘솔 예제를 마련하고,
using System;

namespace ConsoleApplication1
{
    class Program
    {
        static void Main(string[] args)
        {
            if (args.Length == 2)
            {
                Console.WriteLine("Args == 2");
            }
            else
            {
                Console.WriteLine("Args != 2");
            }

            TestIt();
            Console.WriteLine("Main");
        }

        private static void TestIt()
        {
            Console.WriteLine("TestIt");
            TestIt2();
        }

        private static void TestIt2()
        {
            Console.WriteLine("TestIt2");
        }
    }
}
빌드한 후, 이 프로그램을 OpenCover.Console.exe의 인자로 전달해 실행해 줍니다.
c:\temp\ConsoleApplication1\bin\Debug>c:\temp\OpenCover.Console.exe -target:c:\temp\ConsoleApplication1\bin\Debug\ConsoleApplication1.exe -register:user -filter:+[*]*
Executing: c:\temp\ConsoleApplication1\bin\Debug\ConsoleApplication1.exe
Args != 2
TestIt
TestIt2
Main
Committing...
Visited Classes 1 of 1 (100)
Visited Methods 3 of 3 (100)
Visited Points 15 of 18 (83.33)
Visited Branches 4 of 5 (80)

==== Alternative Results (includes all methods including those without corresponding source) ====
Alternative Visited Classes 1 of 1 (100)
Alternative Visited Methods 3 of 4 (75)
ConsoleApplication1.exe 프로세스가 실행이 완료되면 results.xml 파일이 나오는데요. 이 파일은 ConsoleApplication1.exe가 구동되면서 실행된 메서드들의 코드 커버리지 결과를 XML 형식으로 담고 있습니다. 이것을 ReportGenerator 도구를 이용해 html로 변환해 볼 수 있습니다. 따라서 다음의 도구를 다운로드 받고,
danielpalme/ReportGenerator
; https://github.com/danielpalme/ReportGenerator/releases
이렇게 실행해 주면,
c:\temp\ConsoleApplication1\bin\Debug>c:\temp\ReportGenerator.exe -reports:c:\temp\ConsoleApplication1\bin\Debug\results.xml -targetdir:coverage
Loading report 'c:\temp\ConsoleApplication1\bin\Debug\results.xml'
 Preprocessing report
 Initiating parser for OpenCover
  Current Assembly: ConsoleApplication1
Initializing report builders for report types: Html
Analyzing 1 classes
 Creating report 1/1 (Assembly: ConsoleApplication1, Class: ConsoleApplication1.Program)
 Creating summary
Report generation took 0.9 seconds
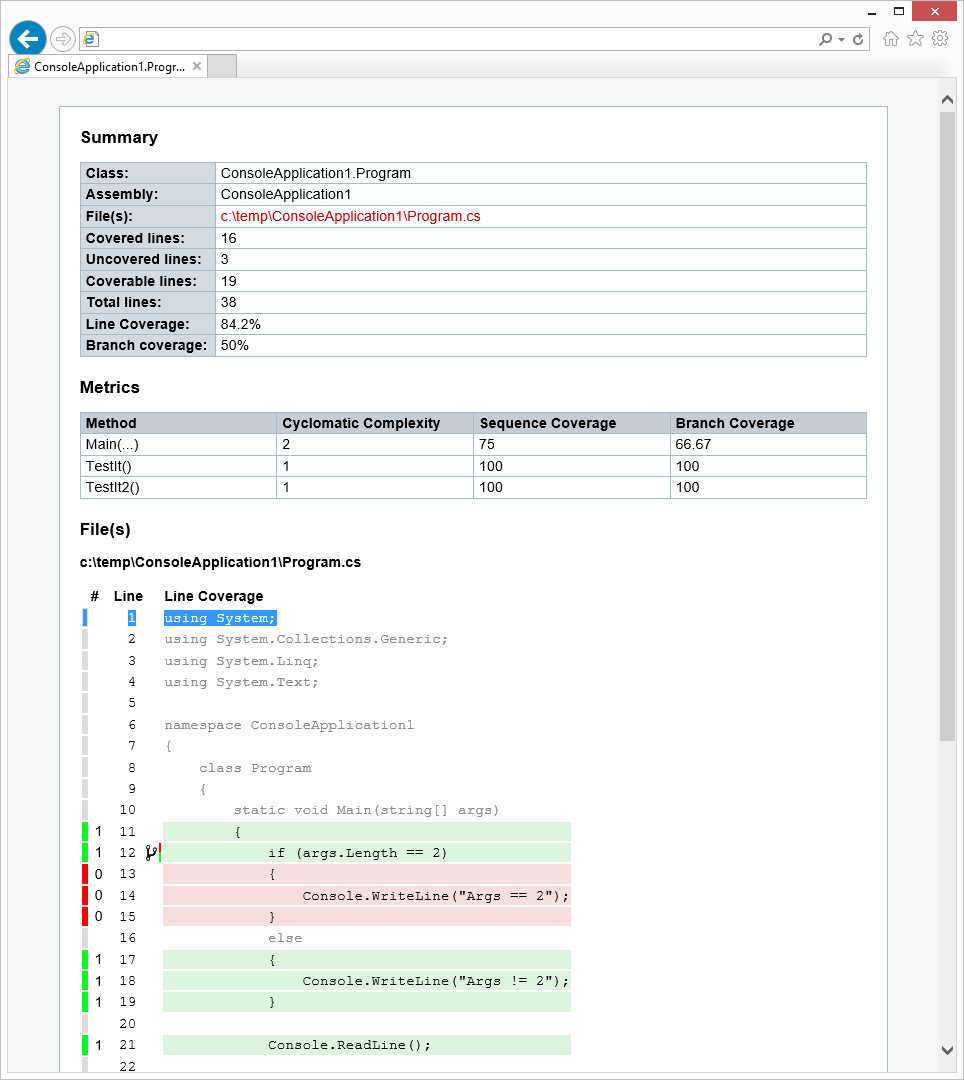
coverage 폴더 하위에 html 파일들이 생성됩니다. 그중에서, index.htm을 실행하면 다음 화면과 같이 ConsoleApplication1.exe 실행 중 코드 커버리지 된 내용을 쉽게 파악할 수 있습니다.
멋지군요. ^^
참고로, "Semantic Designs"의 방식과 비교하면? "Semantic Designs" 제품은 소스 코드를 변경해서 빌드하기 때문에 실행시 부담이 거의 없습니다. 하지만, OpenCover는 실행 시 메서드의 IL 코드를 분석해 변경하는 .NET Profiler 기술을 사용하고 있기 때문에 동작이 좀 느립니다. 하지만, 적용 방식은 "Semantic Designs" 제품이 소스 코드의 변경이 필요하다는 점에서 "제품의 빌드 프로세스"에 참여할 필요가 있지만, OpenCover는 최종 빌드된 제품을 대상으로 하기 때문에 코드 커버리지를 원할 때만 OpenCover.Console.exe에 실어서 실행하기 때문에 더 편리합니다.
OpenCover.Console.exe는 인자로 받은 실행 파일을 구동하면서 다음과 같은 환경 변수를 전달합니다.
Cor_Enable_Profiling=1
Cor_Profiler={1542C21D-80C3-45E6-A56C-A9C1E4BEB7B8}
CoreClr_Profiler={1542C21D-80C3-45E6-A56C-A9C1E4BEB7B8}
OpenCover_Profiler_Key=DC566F4C
OpenCover_Profiler_Namespace=Local
OpenCover_Profiler_Threshold=0
이 중에서 OpenCover_Profiler_Key는 프로세스 실행시마다 달라집니다. 즉, 이 값을 기반으로 .NET Profiler(OpenCover.Profiler.dll)와 OpenCover.Console.exe 간의 통신 용 커널 핸들을 생성합니다.
마지막으로, 실행 시 다음과 같은 오류가 발생할 수 있습니다.
c:\temp\ConsoleApplication1\bin\Debug>c:\temp\OpenCover.Console.exe -target:c:\temp\ConsoleApplication1\bin\Debug\ConsoleApplication1.exe -register:user -filter:+[*]*
Executing: c:\temp\ConsoleApplication1\bin\Debug\ConsoleApplication1.exe
Args != 2
TestIt
TestIt2
Main
Committing...
No results, this could be for a number of reasons. The most common reasons are:
    1) missing PDBs for the assemblies that match the filter please review the output file and refer to the Usage guide (Usage.rtf) about filters.
    2) the profiler may not be registered correctly, please refer to the Usage guide and the -register switch.
왜냐하면, OpenCover는 소스 코드의 위치를 PDB파일과 연계해 알아내기 때문에 반드시 exe 파일과 함께 빌드 당시의 pdb 파일이 함께 위치하고 있어야 합니다. (또는 -register와 같은 옵션을 생략해도 같은 오류 메시지가 뜹니다.)
[이 글에 대해서 여러분들과 의견을 공유하고 싶습니다. 틀리거나 미흡한 부분 또는 의문 사항이 있으시면 언제든 댓글 남겨주십시오.]