MathNET + OxyPlot을 이용한 간단한 통계 정보 처리 - Histogram
MathNET Numerics 라이브러리의,
C# - MathNet.Numerics의 Matrix(행렬) 연산
; https://www.sysnet.pe.kr/2/0/11910
통계 관련한 간단한 사용법을 볼까요? ^^ 우선, 다양한 평균에 대한 메서드입니다.
int [] heightInfo = LoadData("data.txt");

double [] dblHeights = (from elem in heightInfo
                    select (double)elem).ToArray();

Console.WriteLine($"Mean: {Statistics.Mean(dblHeights)}"); // 산술평균
Console.WriteLine($"GeometricMean: {Statistics.GeometricMean(dblHeights)}"); // 기하평균
Console.WriteLine($"HarmonicMean: {Statistics.HarmonicMean(dblHeights)}"); // 조화평균
Console.WriteLine($"RootMeanSquare: {Statistics.RootMeanSquare(dblHeights)}"); // 제곱평균
자동 히스토그램은 구간 수만 정해 주면 됩니다.
Histogram hist = new Histogram(dblHeights, 6);
또는, 상/하위 구간을 지정해 줄 수도 있습니다.
Histogram hist = new Histogram(dblHeights, 6, 141, 170);
아니면, 구간 자체를 사용자 정의하는 것도 가능합니다.
Histogram hist = new Histogram();

hist.AddBucket(new Bucket(141, 145));
hist.AddBucket(new Bucket(145, 150));
hist.AddBucket(new Bucket(150, 155));
hist.AddBucket(new Bucket(155, 160));
hist.AddBucket(new Bucket(160, 165));
hist.AddBucket(new Bucket(165, 170));

hist.AddData(dblHeights);
보는 바와 같이 계급 구간을 Bucket 타입으로 지정하는데,
public Bucket(double lowerBound, double upperBound);
상/하한 기준 값이 double이라는 점과 데이터 비교 기준이 다음과 같다는 점을 염두에 두어야 합니다.
(lowerBound, upperBound]

lowerBound < x <= upperBound
따라서 145 값을 주면 0번 Bucket에 계산되지만, 145.1을 주면 1번 Bucket에 계산됩니다.
상/하한 기준 값이 double이라는 점 때문에 계급값을 범용적으로 계산하는 것도 좀 이상해지긴 하지만, 그런 탓인지 Bucket 타입에는 계급값에 대한 속성이 없습니다. 또한, Histogram의 경우 계급값과 상대도수를 이용한 평균을 내주는 기능도 없으므로 이런 부분들은 임의로 여러분들이 다음과 같은 확장 메서드를 만들어 주어야 합니다.
public static class BucketExtension
{
    public static double GetClassMark(this Bucket bucket)
    {
        return Math.Round((bucket.LowerBound + bucket.UpperBound) / 2, MidpointRounding.AwayFromZero);
    }

    public static double GetRelativeFrequency(this Bucket bucket, Histogram histogram)
    {
        return bucket.Count / histogram.DataCount;
    }
}

public static class HistogramExtension
{
    public static void Output(this Histogram histogram)
    {
        for (int i = 0; i < histogram.BucketCount; i++)
        {
            Console.WriteLine($"{histogram[i].GetClassMark()} == {histogram[i].Count}");
        }
    }

    public static double Mean(this Histogram histogram)
    {
        double mean = 0.0;

        for (int i = 0; i < histogram.BucketCount; i++)
        {
            Bucket bucket = histogram[i];

            double classMark = bucket.GetClassMark();
            double relativeFrequency = bucket.GetRelativeFrequency(histogram);

            mean += (classMark * relativeFrequency);
        }

        return mean;
    }
}
그래서 다음과 같은 정도로 사용해 줄 수 있습니다.
Histogram hist = new Histogram();
hist.AddBucket(new Bucket(141, 145));
hist.AddBucket(new Bucket(145, 150));
hist.AddBucket(new Bucket(150, 155));
hist.AddBucket(new Bucket(155, 160));
hist.AddBucket(new Bucket(160, 165));
hist.AddBucket(new Bucket(165, 170));
hist.AddData(dblHeights);
hist.Output();
Console.WriteLine($"Mean of histogram: {hist.GetMean()}");
/*
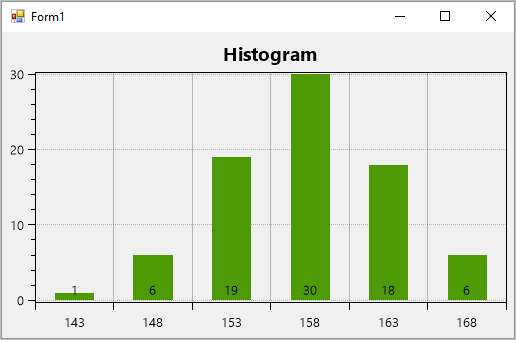
출력 결과:
143 == 1
148 == 6
153 == 19
158 == 30
163 == 18
168 == 6
Mean of histogram: 157.75
*/
그래도 히스토그램은 역시 그래프로 봐야 제맛이죠? ^^
OxyPlot을 이용해,
C# Plotting 라이브러리 OxyPlot
; https://www.sysnet.pe.kr/2/0/10973

C# - OxyPlot 라이브러리로 복소수 표현
; https://www.sysnet.pe.kr/2/0/10974

Docs / Model / Series
; http://docs.oxyplot.org/en/latest/models/series/index.html
다음과 같은 정도로 그려낼 수 있습니다.
Histogram hist = GetHistogram(dblHeights);
plotView1.Model = GetHistogramModel(hist);

public PlotModel GetHistogramModel(Histogram hist)
{
    PlotModel model = new PlotModel();

    CategoryAxis xaxis = new CategoryAxis();
    xaxis.Position = AxisPosition.Bottom;
    xaxis.MajorGridlineStyle = LineStyle.Solid;
    xaxis.MinorGridlineStyle = LineStyle.Dot;

    for (int i = 0; i < hist.BucketCount; i++)
    {
        xaxis.Labels.Add(hist[i].GetClassMark().ToString());
    }

    LinearAxis yaxis = new LinearAxis();
    yaxis.Position = AxisPosition.Left;
    yaxis.MajorGridlineStyle = LineStyle.Dot;
    xaxis.MinorGridlineStyle = LineStyle.Dot;

    ColumnSeries series = new ColumnSeries();
    series.IsStacked = true;
    series.LabelPlacement = LabelPlacement.Base;
    series.LabelFormatString = "{0}";

    for (int i = 0; i < hist.BucketCount; i++)
    {
        ColumnItem item = new ColumnItem(hist[i].Count);
        series.Items.Add(item);
    }

    model = new PlotModel();
    model.Title = "Histogram";

    model.Axes.Add(xaxis);
    model.Axes.Add(yaxis);
    model.Series.Add(series);

    return model;
}
(
첨부 파일은 이 글의 소스 코드를 포함합니다.)
[이 글에 대해서 여러분들과 의견을 공유하고 싶습니다. 틀리거나 미흡한 부분 또는 의문 사항이 있으시면 언제든 댓글 남겨주십시오.]