닷넷에서 EIP/RIP 레지스터 값을 구하는 방법
C++ x64에서 RIP 레지스터 값을 구하는 가장 쉬운 방법은 RtlCaptureContext Win32 API를 사용하는 것입니다.
#include "stdafx.h"

int _tmain(int argc, _TCHAR* argv[])
{
    CONTEXT ctx;

    ZeroMemory(&ctx, sizeof(CONTEXT));
    ctx.ContextFlags = CONTEXT_FULL;

    RtlCaptureContext(&ctx); // ctx.Rip 필드에 다음 코드인 'return 0'의 "xor eax, eax" 명령어를 가리키는 주소를 담고 있음.

    return 0;
}
아쉽게도 이 방법은 닷넷에서 써 먹을 수 없습니다.
[DllImport("Kernel32.dll", SetLastError = true)]
extern static void RtlCaptureContext(ref byte[] contextRecord);

static void Function()
{
    byte [] contents = new byte [1232]; // 1232 == sizeof(CONTEXT)

    byte [] length = BitConverter.GetBytes((int)1048587); // CONTEXT_FULL == 1048587;
    Array.Copy(length, 0, contents, 8 * 6, 4);            // ContextFlags의 옵셋 위치 값: 48

    RtlCaptureContext(ref contents);
}
위와 같이 실행하면 RtlCaptureContext 명령어 실행에서 프로그램이 비정상 종료합니다. 심지어 해당 닷넷 프로젝트의 "Debug" / "Enable native code debugging"을 켜고 작업하게 되면 exe 프로세스가 살아 있는 희한한 현상마저 겪게 됩니다.
그래서 다른 방법을 생각해 보았습니다. 혹시 어셈블리의 도움을 받으면 되지 않을까 싶었는데요. 아쉽게도 x86/x64 모두 eip/rip 레지스터를 직접 접근하는 것은 어셈블리 코드에서 허용되지 않았습니다.
물론, 우회 방법이 있습니다. ret 시에 스택에 보관된 반환 주소를 활용하는 것입니다. 즉, 다음과 같이 만들면 [rsp]에 보관된 리턴 주소를 얻을 수 있으므로 해당 코드가 실행된 곳의 (E/R)IP 주소를 구할 수 있는 것입니다.
.code

    GetIpRegisterValue64 PROC
        mov rax, [rsp]
        ret

    GetIpRegisterValue64 ENDP

END
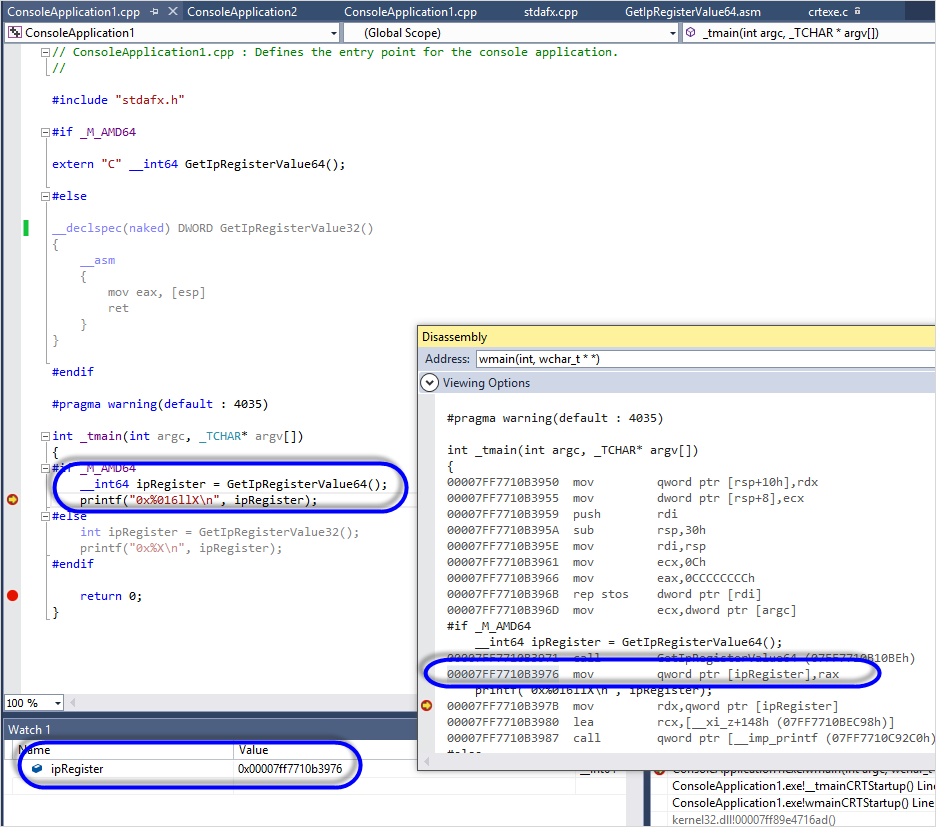
이를 컴파일하고 생성된 .obj 파일을 C/C++ 프로젝트와 결합해 결과를 확인할 수 있습니다. 32비트의 상황까지 고려해 다음과 같이 만들고 디버그 모드에서 확인해 보면,
#include "stdafx.h"

#if _M_AMD64

extern "C" __int64 GetIpRegisterValue64();

#else

__declspec(naked) DWORD GetIpRegisterValue32()
{
    __asm
    {
        mov eax, [esp]
        ret
    }
}

#endif

#pragma warning(default : 4035)

int _tmain(int argc, _TCHAR* argv[])
{
#if _M_AMD64
    __int64 ipRegister = GetIpRegisterValue64();
    printf("0x%016llX\n", ipRegister);
#else
    int ipRegister = GetIpRegisterValue32();
    printf("0x%X\n", ipRegister);
#endif

    return 0;
}
예상했던 대로 호출된 부근의 IP 레지스터 값을 얻을 수 있습니다.
오호... 그런대로 효과가 있습니다. ^^
참고로, 다음과 같이 LABEL을 사용한 방법도 있습니다.
Walking the stack of the current thread
; http://jpassing.com/2008/03/12/walking-the-stack-of-the-current-thread/
CONTEXT Context;
ZeroMemory( &Context, sizeof( CONTEXT ) );
Context.ContextFlags = CONTEXT_CONTROL;

__asm
{
Label:
  mov [Context.Ebp], ebp;
  mov [Context.Esp], esp;
  mov eax, [Label];
  mov [Context.Eip], eax;
}
반환 주소를 이용한 IP 주소를 얻는 방법을 닷넷에 적용해 보면 어떨까요? inline-assembly를 .NET으로 포팅하는 방법에 대해서는 지난 글에서 이미 설명드렸습니다.
C++의 inline asm 사용을 .NET으로 포팅하는 방법
; https://www.sysnet.pe.kr/2/0/1267
이를 위해 Visual Studio 디스어셈블리 창에서 x86/x64 각각에 대해 기계어 코드를 구하면 다음과 같습니다.
========= x86 =========

00FA3DB0 8B 04 24             mov         eax,dword ptr [esp]
00FA3DB3 C3                   ret


========= x64 =========

00007FF7457B13E0 48 8B 04 24          mov         rax,qword ptr [rsp]
00007FF7457B13E4 C3                   ret
다음의 코드는 위의 기계어를 그대로 .NET Delegate에 연결해 주고 있습니다.
using System;
using System.Runtime.InteropServices;

namespace ConsoleApplication2
{
    class Program
    {
        private readonly static byte[] x86GetIp =
        {
            0x8b, 0x04, 0x24,  // mov eax, dword ptr [esp]
            0xc3,   // ret
        };

        private readonly static byte[] x64GetIp =
        {
            0x48, 0x8b, 0x04, 0x24, // mov rax, qword ptr [rsp]
            0xc3,   // ret
        };

        [Flags()]
        private enum AllocationType : uint
        {
            COMMIT = 0x1000,
            RESERVE = 0x2000,
            RESET = 0x80000,
            LARGE_PAGES = 0x20000000,
            PHYSICAL = 0x400000,
            TOP_DOWN = 0x100000,
            WRITE_WATCH = 0x200000
        }

        [Flags()]
        public enum MemoryProtection : uint
        {
            EXECUTE = 0x10,
            EXECUTE_READ = 0x20,
            EXECUTE_READWRITE = 0x40,
            EXECUTE_WRITECOPY = 0x80,
            NOACCESS = 0x01,
            READONLY = 0x02,
            READWRITE = 0x04,
            WRITECOPY = 0x08,
            GUARD_Modifierflag = 0x100,
            NOCACHE_Modifierflag = 0x200,
            WRITECOMBINE_Modifierflag = 0x400
        }

        [DllImport("kernel32.dll", SetLastError = true)]
        private static extern IntPtr VirtualAlloc(IntPtr lpAddress, UIntPtr dwSize, AllocationType flAllocationType,
            MemoryProtection flProtect);

        [DllImport("kernel32")]
        private static extern bool VirtualFree(IntPtr lpAddress, UInt32 dwSize, UInt32 dwFreeType);

        [UnmanagedFunctionPointerAttribute(CallingConvention.Cdecl)]
        private delegate int GetIPRegister32();

        [UnmanagedFunctionPointerAttribute(CallingConvention.StdCall)]
        private delegate long GetIPRegister64();

        static void Main(string[] args)
        {
            TestIt();
        }

        private static void TestIt()
        {
            IntPtr _codePointer;

            GetIPRegister32 _x86Call;
            GetIPRegister64 _x64Call;

            byte[] codeBytes = x86GetIp;

            if (IntPtr.Size == 8)
            {
                codeBytes = x64GetIp;
            }

            _codePointer = VirtualAlloc(IntPtr.Zero, new UIntPtr((uint)codeBytes.Length),
                AllocationType.COMMIT | AllocationType.RESERVE,
                MemoryProtection.EXECUTE_READWRITE
            );

            Marshal.Copy(codeBytes, 0, _codePointer, codeBytes.Length);

            if (IntPtr.Size == 4)
            {
                _x86Call = (GetIPRegister32)Marshal.GetDelegateForFunctionPointer(
                      _codePointer, typeof(GetIPRegister32));

                Console.WriteLine(_x86Call());
            }
            else
            {
                _x64Call = (GetIPRegister64)Marshal.GetDelegateForFunctionPointer(
                      _codePointer, typeof(GetIPRegister64));

                long result = _x64Call();
                Console.WriteLine(result);
            }

            if (_codePointer != IntPtr.Zero)
            {
                VirtualFree(_codePointer, 0, 0x8000);
                _codePointer = IntPtr.Zero;
            }
        }
    }
}
처음엔 이렇게 해주면 실행한 곳의 IP 주소를 구할 수 있을 거라 생각했는데... 아쉽게도 delegate가 별도의 클래스라는 점을 간과하고 있었습니다.
실제로 windbg를 붙여서 디버깅하기 쉽게 Main과 TestIt 메서드에 다음과 같이 코드를 추가해 두고,
static void Main(string[] args)
{
    Console.WriteLine("attach debugger");
    Console.ReadLine();

    // ... [생략] ...

    TestIt();
}

private static void TestIt()
{
    // ... [생략] ...

    if (IntPtr.Size == 4)
    {
        // ... [생략] ...
    }
    else
    {
        // ... [생략] ...

        Console.WriteLine("watch this");
        Console.ReadLine();

        long result = _x64Call();

        Console.WriteLine(result);
    }

    // ... [생략] ...
}
실행한 다음 "attach debugger" 메시지가 출력되었을 때 windbg를 실행시켜 붙인 다음 아래와 같은 과정을 통해 실제 _x64Call이 일어날 시점의 메서드 깊이까지 추적해 보았습니다.
0:003> .loadby sos clr

0:003> !clrstack
OS Thread Id: 0x134c (3)
Unable to walk the managed stack. The current thread is likely not a
managed thread. You can run !threads to get a list of managed threads in
the process
Failed to start stack walk: 80070057

0:003> !threads
ThreadCount:      2
UnstartedThread:  0
BackgroundThread: 1
PendingThread:    0
DeadThread:       0
Hosted Runtime:   no
                                                                                                        Lock
       ID OSID ThreadOBJ           State GC Mode     GC Alloc Context                  Domain           Count Apt Exception
   0    1 2a8c 0000000000fd37b0    2a020 Preemptive  0000000002E366D0:0000000002E37FD0 0000000000fc78c0 1     MTA
   2    2 1d3c 0000000000fdfa50    2b220 Preemptive  0000000000000000:0000000000000000 0000000000fc78c0 0     MTA (Finalizer)

0:001> ~0s
ntdll!NtReadFile+0xa:
00007ffb`1482ad6a c3              ret

0:000> !clrstack
OS Thread Id: 0x2a8c (0)
        Child SP               IP Call Site
0000000000e8eaa0 00007ffb1482ad6a [InlinedCallFrame: 0000000000e8eaa0] Microsoft.Win32.Win32Native.ReadFile(Microsoft.Win32.SafeHandles.SafeFileHandle, Byte*, Int32, Int32 ByRef, IntPtr)
0000000000e8eaa0 00007ffb00aa6c92 [InlinedCallFrame: 0000000000e8eaa0] Microsoft.Win32.Win32Native.ReadFile(Microsoft.Win32.SafeHandles.SafeFileHandle, Byte*, Int32, Int32 ByRef, IntPtr)
0000000000e8ea60 00007ffb00aa6c92 DomainNeutralILStubClass.IL_STUB_PInvoke(Microsoft.Win32.SafeHandles.SafeFileHandle, Byte*, Int32, Int32 ByRef, IntPtr)
0000000000e8eb60 00007ffb013bc983 System.IO.__ConsoleStream.ReadFileNative(Microsoft.Win32.SafeHandles.SafeFileHandle, Byte[], Int32, Int32, Boolean, Boolean, Int32 ByRef)
0000000000e8ebe0 00007ffb013bc7f8 System.IO.__ConsoleStream.Read(Byte[], Int32, Int32)
0000000000e8ec50 00007ffb00a06e23 System.IO.StreamReader.ReadBuffer()
0000000000e8eca0 00007ffb00a509f7 System.IO.StreamReader.ReadLine()
0000000000e8ecf0 00007ffb013c574d System.IO.TextReader+SyncTextReader.ReadLine()
0000000000e8ed50 00007ffaa27001a7 ConsoleApplication2.Program.Main(System.String[]) [c:\...\ConsoleApplication2\Program.cs @ 68]
0000000000e8f060 00007ffb01d80453 [GCFrame: 0000000000e8f060]
보시는 바와 같이 현재 Console.ReadLine에 실행이 멈춰 있습니다. 이제 TestIt 메서드에 BreakPoint를 걸고 실행을 계속하면 TestIt 메서드 진입점에서 멈춥니다.
0:000> !bpmd ConsoleApplication2 ConsoleApplication2.Program.TestIt
Found 1 methods in module 00007ffaa25e2fc8...
MethodDesc = 00007ffaa25e4110
Adding pending breakpoints..

0:000> g
(2d00.2a8c): CLR notification exception - code e0444143 (first chance)
JITTED ConsoleApplication2!ConsoleApplication2.Program.TestIt()
Setting breakpoint: bp 00007FFAA270020D [ConsoleApplication2.Program.TestIt()]
Breakpoint 0 hit
00007ffa`a270020d 90              nop
다시 'g' 명령을 내려서 계속 실행하면 _x64Call() 호출 바로 전의 Console.ReadLine까지 실행되는데, 거기서 디스어셈블리 창을 보면,
00007ffa`a26f03a5 90              nop
00007ffa`a26f03a6 e875c8b55e      call    mscorlib_ni+0xcfcc20 (00007ffb`0124cc20)
00007ffa`a26f03ab 4889842498000000 mov     qword ptr [rsp+98h],rax ss:00000000`006be9c8=60ea6b0000000000
00007ffa`a26f03b3 90              nop
00007ffa`a26f03b4 488b4c2430      mov     rcx,qword ptr [rsp+30h]
00007ffa`a26f03b9 488b4908        mov     rcx,qword ptr [rcx+8]
00007ffa`a26f03bd 488b442430      mov     rax,qword ptr [rsp+30h]
00007ffa`a26f03c2 ff5018          call    qword ptr [rax+18h]
00007ffa`a26f03c5 48898424a0000000 mov     qword ptr [rsp+0A0h],rax
00007ffa`a26f03cd 488b8424a0000000 mov     rax,qword ptr [rsp+0A0h]
00007ffa`a26f03d5 4889442440      mov     qword ptr [rsp+40h],rax
내부에서 델리게이트 타입의 내부 함수를 호출하는 단계로 넘어갑니다. 이 안으로 진입해서 디버깅을 계속해 보면, 다음과 같이 실제로 우리가 만든 기계어 코드로의 호출이 발견됩니다.
00007ffa`a26f0630 48894c2408      mov     qword ptr [rsp+8],rcx ss:00000000`006be930=b066580200000000
00007ffa`a26f0635 55              push    rbp
00007ffa`a26f0636 53              push    rbx
00007ffa`a26f0637 56              push    rsi
00007ffa`a26f0638 57              push    rdi
00007ffa`a26f0639 4154            push    r12
00007ffa`a26f063b 4155            push    r13
00007ffa`a26f063d 4156            push    r14
00007ffa`a26f063f 4157            push    r15
00007ffa`a26f0641 4881eca8000000  sub     rsp,0A8h
00007ffa`a26f0648 488d6c2420      lea     rbp,[rsp+20h]
00007ffa`a26f064d 4c895560        mov     qword ptr [rbp+60h],r10
00007ffa`a26f0651 c7450000000000  mov     dword ptr [rbp],0
00007ffa`a26f0658 48c7450800000000 mov     qword ptr [rbp+8],0
00007ffa`a26f0660 48c7451000000000 mov     qword ptr [rbp+10h],0
00007ffa`a26f0668 488b4560        mov     rax,qword ptr [rbp+60h]
00007ffa`a26f066c 48894518        mov     qword ptr [rbp+18h],rax
00007ffa`a26f0670 488b5518        mov     rdx,qword ptr [rbp+18h]
00007ffa`a26f0674 488d4d28        lea     rcx,[rbp+28h]
00007ffa`a26f0678 e81b43645f      call    clr!JIT_InitPInvokeFrame (00007ffb`01d34998)
00007ffa`a26f067d 48894568        mov     qword ptr [rbp+68h],rax
...
00007ffa`a26f06b9 488b4d70        mov     rcx,qword ptr [rbp+70h]
00007ffa`a26f06bd 488b4518        mov     rax,qword ptr [rbp+18h]
00007ffa`a26f06c1 48894538        mov     qword ptr [rbp+38h],rax
00007ffa`a26f06c5 488d0514000000  lea     rax,[00007ffa`a26f06e0]
00007ffa`a26f06cc 48894550        mov     qword ptr [rbp+50h],rax
00007ffa`a26f06d0 488b4568        mov     rax,qword ptr [rbp+68h]
00007ffa`a26f06d4 c7400c00000000  mov     dword ptr [rax+0Ch],0
00007ffa`a26f06db 4533db          xor     r11d,r11d
00007ffa`a26f06de ffd1            call    rcx

00000000`00a3fffe 0000            add     byte ptr [rax],al
00000000`00a40000 488b0424        mov     rax,qword ptr [rsp] ss:00000000`006be838=e0066fa2fa7f0000
00000000`00a40004 c3              ret
00000000`00a40005 0000            add     byte ptr [rax],al
결국, 우리가 얻게 되는 IP 주소는 닷넷 델리게이트 타입의 Invoke 함수가 위치한 코드의 주소일 뿐입니다. (업데이트:
이러한 불일치를 C# 9.0의 함수 포인터를 이용하면 해결할 수 있습니다.)
호출 스택을 풀이해서 부모의 부모까지 가자니 왠지 귀찮습니다. (이런 코드는 자칫 안정성에도 위협이 될 수 있으니 조심해야 합니다.) 그래서 조금 더 생각해 보니, 예전에 쓴 글이 생각났습니다. ^^
상황별 GetFunctionPointer 반환값 정리
; https://www.sysnet.pe.kr/2/0/1027
그렇습니다. 우리는 GetFunctionPointer 메서드를 통해 함수의 진입점 주소를 알 수 있습니다.
static void Main(string[] args)
{
    foreach (MethodInfo mi in typeof(Program).GetMethods(BindingFlags.NonPublic | BindingFlags.Static))
    {
        if (mi.Name == "TestIt")
        {
            RuntimeHelpers.PrepareMethod(mi.MethodHandle);
            Console.WriteLine(mi.MethodHandle.GetFunctionPointer().ToString("x")); // TestIt 메서드의 진입점 주소
        }
    }

    TestIt();
}
위의 코드 실행 결과로 출력된 값이 해당 메서드의 주소인지 windbg를 통해 확인해 볼 수 있습니다. 일단, 출력 결과는 "00007ffaa26e03c0" 값이었습니다.
0:003> .loadby sos clr

0:003> !bpmd ConsoleApplication2 ConsoleApplication2.Program.TestIt
Found 1 methods in module 00007ffaa25c2fc8...
MethodDesc = 00007ffaa25c4110
Adding pending breakpoints...

0:003> g
(31d8.3268): CLR notification exception - code e0444143 (first chance)
JITTED ConsoleApplication2!ConsoleApplication2.Program.TestIt()
Setting breakpoint: bp 00007FFAA26E03FD [ConsoleApplication2.Program.TestIt()]
Breakpoint 0 hit
00007ffa`a26e03fd 90              nop
오호~~~ 그런데 값이 일치하지 않는군요. 화면의 GetFunctionPointer 출력값은 00007ffa`a26e03c0이지만, BP가 걸린 곳은 00007ffa`a26e03fd입니다. 차이값은 61(= 00000000`0000003d) 바이트 정도입니다. name2ee 명령어를 통해 확인해도 역시 GetFunctionPointer 값과 일치합니다.
0:000> !name2ee ConsoleApplication2.exe!ConsoleApplication2.Program.TestIt
Module:      00007ffaa25c2fc8
Assembly:    ConsoleApplication2.exe
Token:       0000000006000004
MethodDesc:  00007ffaa25c4110
Name:        ConsoleApplication2.Program.TestIt()
JITTED Code Address: 00007ffaa26e03c0
혹시나 싶어 00007ffaa26e03c0 주소를 역어셈블하면 다음과 같이 나옵니다.
00007ffa`a26e03c0 4881ecc8000000  sub     rsp,0C8h
00007ffa`a26e03c7 33c0            xor     eax,eax
00007ffa`a26e03c9 4889442438      mov     qword ptr [rsp+38h],rax
00007ffa`a26e03ce 4889442430      mov     qword ptr [rsp+30h],rax
00007ffa`a26e03d3 4889442428      mov     qword ptr [rsp+28h],rax
00007ffa`a26e03d8 33c0            xor     eax,eax
00007ffa`a26e03da 88442448        mov     byte ptr [rsp+48h],al
00007ffa`a26e03de 4889442440      mov     qword ptr [rsp+40h],rax
00007ffa`a26e03e3 4889442420      mov     qword ptr [rsp+20h],rax
00007ffa`a26e03e8 48b838345ca2fa7f0000 mov rax,7FFAA25C3438h
00007ffa`a26e03f2 8b00            mov     eax,dword ptr [rax]
00007ffa`a26e03f4 85c0            test    eax,eax
00007ffa`a26e03f6 7405            je      00007ffa`a26e03fd
00007ffa`a26e03f8 e8f335b15f      call    clr!JIT_DbgIsJustMyCode (00007ffb`021f39f0)

00007ffa`a26e03fd 90              nop
00007ffa`a26e03fe 48b87857431200000000 mov rax,12435778h
00007ffa`a26e0408 488b00          mov     rax,qword ptr [rax]
00007ffa`a26e040b 4889442438      mov     qword ptr [rsp+38h],rax
00007ffa`a26e0410 e8fb5bb35e      call    mscorlib_ni+0xcc6010 (00007ffb`01216010)
00007ffa`a26e0415 89442458        mov     dword ptr [rsp+58h],eax
00007ffa`a26e0419 33c0            xor     eax,eax
아하... 보니까 "JITTED Code Address: 00007ffaa26e03c0" 값은 실제 함수의 진입점을 가리키는 반면 디버거가 BP로 멈춘 지점은 함수의 prolog 부분이 모두 실행된 다음의 위치를 가리킨 것입니다.
자... 그럼 이것으로 GetFunctionPointer 메서드가 반환한 값을 믿을 수 있게 되었습니다.
문제는, 특정 명령어 위치의 IP 주소를 어떻게 구하느냐입니다. 이를 위해 StackFrame 타입을 이용할 수 있습니다. StackFrame에는 해당 타입이 생성된 시기의 (E/R)IP 옵셋값을 담고 있기 때문입니다.
using System;
using System.Diagnostics;

class Program
{
    static void Function()
    {
        StackFrame st = new StackFrame(0, true);
        IntPtr funcAddress = st.GetMethod().MethodHandle.GetFunctionPointer();

        int offset = st.GetNativeOffset();

        Console.WriteLine("func address: " + funcAddress.ToInt64().ToString("x"));
        Console.WriteLine("offset: " + offset.ToString("x"));
    }

    static void Main(string[] args)
    {
        Console.WriteLine("attach debugger");
        Console.ReadLine();

        Function();
    }
}
따라서 GetFunctionPointer 반환값과 GetNativeOffset 값을 합치면 그 명령어가 수행된 IP 주소를 구할 수 있습니다. 실제로 위의 프로그램을 실행시켜서 windbg로 붙여 보면 다음과 같은 디스어셈블 코드를 보게 됩니다.
00007ffa`a26d00f0 4881ecb8000000  sub     rsp,0B8h
00007ffa`a26d00f7 33c0            xor     eax,eax
00007ffa`a26d00f9 4889442440      mov     qword ptr [rsp+40h],rax
00007ffa`a26d00fe 4889442438      mov     qword ptr [rsp+38h],rax
00007ffa`a26d0103 89442430        mov     dword ptr [rsp+30h],eax
00007ffa`a26d0107 4889442428      mov     qword ptr [rsp+28h],rax
00007ffa`a26d010c 48c744242000000000 mov   qword ptr [rsp+20h],0
00007ffa`a26d0115 4889442448      mov     qword ptr [rsp+48h],rax
00007ffa`a26d011a 48b838345ba2fa7f0000 mov rax,7FFAA25B3438h
00007ffa`a26d0124 8b00            mov     eax,dword ptr [rax]
00007ffa`a26d0126 85c0            test    eax,eax
00007ffa`a26d0128 7405            je      00007ffa`a26d012f
00007ffa`a26d012a e8c138b25f      call    clr!JIT_DbgIsJustMyCode (00007ffb`021f39f0)
     *
00007ffa`a26d012f 90              nop
00007ffa`a26d0130 488d0df184525e  lea     rcx,[mscorlib_ni+0x6a8628 (00007ffb`00bf8628)]
00007ffa`a26d0137 e8c421665f      call    clr!JIT_TrialAllocSFastMP_InlineGetThread (00007ffb`01d32300)
00007ffa`a26d013c 4889442450      mov     qword ptr [rsp+50h],rax
00007ffa`a26d0141 488b442450      mov     rax,qword ptr [rsp+50h]
00007ffa`a26d0146 4889442458      mov     qword ptr [rsp+58h],rax
00007ffa`a26d014b 41b001          mov     r8b,1
00007ffa`a26d014e 33d2            xor     edx,edx
00007ffa`a26d0150 488b4c2458      mov     rcx,qword ptr [rsp+58h]
00007ffa`a26d0155 e8d638c35e      call    mscorlib_ni+0xdb3a30 (00007ffb`01303a30)
00007ffa`a26d015a 4c8b5c2458      mov     r11,qword ptr [rsp+58h]
이때의 GetFunctionPointer 반환값은 00007ffa`a26d00f0이고, GetNativeOffset은 6a였습니다. 이를 더하면 00007ffa`a26d015a 값이 되고 이는 new StackFrame의 호출 (call mscorlib_ni+0xdb3a30 (00007ffb`01303a30)) 바로 다음 주소를 가리키고 있습니다. 이 정도면... 뭐 그런대로 원하는 목적을 달성했습니다. ^^
(
첨부 파일은 이 글에 실린 예제 코드를 포함합니다.)
[이 글에 대해서 여러분들과 의견을 공유하고 싶습니다. 틀리거나 미흡한 부분 또는 의문 사항이 있으시면 언제든 댓글 남겨주십시오.]