C++의 32비트 + Release 어셈블리 코드를 .NET으로 포팅할 때 주의할 점
예전에 아래의 글을 소개한 적이 있는데요,
C++의 inline asm 사용을 .NET으로 포팅하는 방법
; https://www.sysnet.pe.kr/2/0/1267
이번에는 저 소스 코드에서 예로 든 cpuid 명령어를 eax 레지스터에 기능 번호를 전달하기 위해 인자를 하나 더 추가해 봤습니다.
#include "stdafx.h"
#include <intrin.h>

__declspec(noinline) __declspec(dllexport)
void __cdecl getCpuId(int bits[], unsigned int functionId)
{
    __cpuid(bits, functionId); // 이 라인에 BP를 잡고 실행
}

int _tmain(int argc, _TCHAR* argv[])
{
  int bits[4];

  getCpuId(bits, 0x80000000);
  printf("%x, %x, %x, %x\n", bits[0], bits[1], bits[2], bits[3]);

  getCpuId(bits, 0x80000002);
  printf("%x, %x, %x, %x\n", bits[0], bits[1], bits[2], bits[3]);

  return 0;
}
그런 다음, getCpuId의 기계어 코드를 최대한 간결하게 얻기 위해 32비트 + Release 모드로 컴파일해 Disassembly 창으로부터 다음과 같은 출력을 얻었습니다.
--- C:\temp\inline-asm-netcore\SystemInfo\SystemInfo.cpp
         EC                   in          al,dx
BP:      8B 45 0C             mov         eax,dword ptr [ebp+0Ch]
         33 C9                xor         ecx,ecx
         53                   push        ebx
         56                   push        esi
         57                   push        edi
         53                   push        ebx
         0F A2                cpuid
         8B FB                mov         edi,ebx
         5B                   pop         ebx
         8B 75 08             mov         esi,dword ptr [ebp+8]
         89 06                mov         dword ptr [esi],eax
         89 7E 04             mov         dword ptr [esi+4],edi
         89 4E 08             mov         dword ptr [esi+8],ecx
         5F                   pop         edi
         89 56 0C             mov         dword ptr [esi+0Ch],edx
         5E                   pop         esi
         5B                   pop         ebx
         5D                   pop         ebp
         C3                   ret
왠지 첫 번째 "in al, dx" 명령어는 상관없는 것 같고, 두 번째 "mov eax, dword ptr [ebp+0Ch]" 명령어부터 유효한 함수의 시작일 것 같아서 저 바이트 코드부터 C#에서 사용했습니다.
그런데 ^^; 실행해 보면 비정상 종료를 합니다.
Unhandled Exception: System.AccessViolationException: Attempted to read or write protected memory. This is often an indication that other memory is corrupt.
   at ConsoleApplication1.SystemInfo.GetCpuId(Byte[] cpuIdBytes, UInt32 functionId) in C:\ConsoleApp\ConsoleApplication1\SystemInfo.cs:line 127
   at ConsoleApplication1.Program.Main(String[] args) in C:\ConsoleApp\ConsoleApplication1\Program.cs:line 12
왜일까요? ^^;
원인 파악을 위해 x86 실행에 대한 바이트 배열에 int 3(0xcc)를 다음과 같이 추가하고,
private readonly static byte[] x86CpuIdBytes =
{
    0x8B, 0x45, 0x0C,    // mov    eax,dword ptr [ebp+0Ch]
    0x33, 0xC9,          // xor    ecx,ecx
    0x53,                // push   ebx
    0x56,                // push   esi
    0x57,                // push   edi
    0x53,                // push   ebx
    0xcc, // int 3
    0x0F, 0xA2,          // cpuid
    0x8B, 0xFB,          // mov    edi,ebx
    0x5B,                // pop    ebx
    0x8B, 0x75, 0x08,    // mov    esi,dword ptr [ebp+8]
    0x89, 0x06,          // mov    dword ptr [esi],eax
    0x89, 0x7E, 0x04,    // mov    dword ptr [esi+4],edi
    0x89, 0x4E, 0x08,    // mov    dword ptr [esi+8],ecx
    0x5F,                // pop    edi
    0x89, 0x56, 0x0C,    // mov    dword ptr [esi+0Ch],edx
    0x5E,                // pop    esi
    0x5B,                // pop    ebx
    0x5D,                // pop    ebp
    0xC3,                // ret
};
테스트 용도로 CPUID를 담을 버퍼의 주소를 출력하는 코드를 살짝 추가한 후,
internal void GetCpuId(byte[] cpuIdBytes, uint functionId)
{
    if (_cpuIdDelg == null)
    {
        throw new ObjectDisposedException("GetCpu");
    }

    GCHandle handle = default(GCHandle);

    try
    {
        handle = GCHandle.Alloc(cpuIdBytes, GCHandleType.Pinned);
        Console.WriteLine("buffer address: 0x" + handle.AddrOfPinnedObject().ToString("X"));
        _cpuIdDelg(cpuIdBytes, functionId);
    }
    finally
    {
        if (handle != default(GCHandle))
        {
            handle.Free();
        }
    }
}
WinDbg를 이용해 실행하면 (제 상태로는) 화면에 버퍼 주소가 0x30E260C로 출력된 후 int 3에서 bp가 걸립니다.
(e50c.e7e0): Break instruction exception - code 80000003 (first chance)
eax=030e260c ebx=030e260c ecx=00000000 edx=01710000 esi=030e2604 edi=0121c9a8
eip=01710009 esp=00daf170 ebp=00daf1bc iopl=0         nv up ei pl zr na pe nc
cs=0023  ss=002b  ds=002b  es=002b  fs=0053  gs=002b             efl=00000246
01710009 cc              int     3

// eip == 01710009이고, VirtualAlloc의 페이지 정렬에 따라 함수의 시작 주소는 01710000로 추측
0:000> u 01710000
01710000 8b450c          mov     eax,dword ptr [ebp+0Ch]
01710003 33c9            xor     ecx,ecx
01710005 53              push    ebx
01710006 56              push    esi
01710007 57              push    edi
01710008 53              push    ebx
01710009 cc              int     3
0171000a 0fa2            cpuid
보는 바와 같이, cpuid에 전달한 function ID 값이 제 코드에서는 0x80000000이었는데 위의 eax 레지스터에는 엉뚱하게 (화면에 버퍼 주솟값으로 출력됐던) 030e260c 값이 있습니다. 게다가 ebp+8 위치의 값에는 원래 버퍼의 주솟값이 들어가 있어야 하는데,
0:000> ? dwo(ebp+8)
Evaluate expression: -2147483648 = 80000000
오히려, 두 번째 인자로 전달한 0x80000000 값이 들어가 있습니다. x86 환경의 (cdecl 호출 규약이라면) ebp 레지스터에 따른 인자 구조로 봤을 때,
ebp + 12: 두 번째 함수 인자
ebp + 8:  첫 번째 함수 인자
ebp + 4:  리턴 주소
ebp + 0:  이전 ebp 값
ebp - 4:  첫 번째 지역 변수
ebp - 8:  두 번째 지역 변수
저 규칙이 전혀 적용되지 않고 있는 것입니다. 결국, 저런 상황에서는 높은 확률로 System.AccessViolationException 예외가 발생할 수밖에 없습니다. 어쨌든, 문제가 있다는 것은 확인했지만,,, 여전히 원인을 모르겠습니다.
자, 그럼 CLR Jitter가 만들어 주는 곳부터 어떤 문제가 있는지 살펴볼까요? 가능한 쉬운 트레이스를 위해 복잡한 중간 코드를 생성하는 delegate보다는 함수 포인터를 이용하는 방법으로 소스 코드를 변경했습니다.
.NET 8 - 함수 포인터에 대한 Reflection 정보 조회
; https://www.sysnet.pe.kr/2/0/13475
public class SystemInfo
{
    // ...[생략]...

    delegate* unmanaged[Cdecl, SuppressGCTransition]<byte*, void> _cpuIdFunc;

    public SystemInfo()
    {
        byte[] codeBytes = (IntPtr.Size == 4) ? x86CpuIdBytes : x64CpuIdBytes;

        _codePointer = VirtualAlloc(IntPtr.Zero, new UIntPtr((uint)codeBytes.Length),
            AllocationType.COMMIT | AllocationType.RESERVE, MemoryProtection.EXECUTE_READWRITE
        );

        Marshal.Copy(codeBytes, 0, _codePointer, codeBytes.Length);

        _cpuIdFunc = (delegate* unmanaged[Cdecl, SuppressGCTransition]<byte*, void>)_codePointer;
    }

    // ...[생략]...
}
그다음, 저 _cpuIdFunc를 호출하기 전 WinDbg에서 추적이 쉽도록 이렇게 코드를 변경했습니다.
Debugger.Launch();
_cpuIdFunc(pBuffer, functionId);
이제 WinDbg를 이용해 실행한 후 _cpuIdFunc를 호출하는 지점을 쉽게 찾을 수 있는데요,
    _cpuIdFunc(pBuffer, functionId);
07be26c9 90             nop
07be26ca 8b45e4         mov     eax, dword ptr [ebp-1Ch]
07be26cd 8b400c         mov     eax, dword ptr [eax+0Ch]
07be26d0 8945d0         mov     dword ptr [ebp-30h], eax
07be26d3 8b45d0         mov     eax, dword ptr [ebp-30h]
07be26d6 8b5508         mov     edx, dword ptr [ebp+8]
07be26d9 8b4dd4         mov     ecx, dword ptr [ebp-2Ch]
07be26dc bb70229c02     mov     ebx, 29C2270h
07be26e1 e800632058     call    coreclr!_GenericPInvokeCalliHelper@0 (5fde89e6)
__clrcall 호출 규약에 따라 ecx, edx에 각각 첫 번째/두 번째 인자를 전달한 후 delegate unmanaged 호출을 대행하는 _GenericPInvokeCalliHelper를 부르고 있습니다. 물론, 이때의 인자에는 정상적인 값이 들어가 있습니다.
ecx == 0494b820   // cpuid를 담기 위해 전달한 버퍼
edx == 80000000   // cpuid에 전달한 기능 번호
재미있게도, 마이크로소프트가 symbol 서버를 잘 운영해 준 덕분에 WinDbg는 저 코드에서 step-into(F11)로 진행하면 소스 코드 창에 다음과 같이 _GenericPInvokeCalliHelper 원본을 함께 보여줍니다.
;==========================================================================
; Invoked for marshaling-required unmanaged CALLI calls as a stub.
; EAX       - the unmanaged target
; ECX, EDX  - arguments
; EBX       - the VASigCookie
;
_GenericPInvokeCalliHelper@0 proc public

    cmp     dword ptr [ebx + VASigCookie__StubOffset], 0
    jz      GoCallCalliWorker

    ; Stub is already prepared, just jump to it
    jmp     dword ptr [ebx + VASigCookie__StubOffset]

GoCallCalliWorker:
    ;
    ; call the stub generating worker
    ; target ptr in EAX, VASigCookie ptr in EBX
    ;

    STUB_PROLOG

    mov         esi, esp

    ; save target
    push        eax

    push        eax                         ; unmanaged target
    push        ebx                         ; pVaSigCookie (first stack argument)
    push        esi                         ; pTransitionBlock

    call        _GenericPInvokeCalliStubWorker@12

    ; restore target
    pop     eax

    STUB_EPILOG

    ; jump back to the helper - this time it won't come back here as the stub already exists
    jmp _GenericPInvokeCalliHelper@0
소스 코드가 길지만 사실상 "jmp _GenericPInvokeCalliHelper@0" 호출로 바로 실행되고, 이후의 코드는 동적으로 생성된 코드라 소스 코드 연동이 안돼 disassembly 창에서만 확인이 됩니다.
07be2760 55           push    ebp
07be2761 8bec         mov     ebp, esp
07be2763 57           push    edi
07be2764 83ec18       sub     esp, 18h
07be2767 8945e4       mov     dword ptr [ebp-1Ch], eax
07be276a 894df8       mov     dword ptr [ebp-8], ecx
07be276d 8955f4       mov     dword ptr [ebp-0Ch], edx
07be2770 33c0         xor     eax, eax
07be2772 8945f0       mov     dword ptr [ebp-10h], eax
07be2775 90           nop
07be2776 8b45f8       mov     eax, dword ptr [ebp-8]
07be2779 8945ec       mov     dword ptr [ebp-14h], eax
07be277c 90           nop
07be277d 90           nop
07be277e 8b45f4       mov     eax, dword ptr [ebp-0Ch]
07be2781 8945e8       mov     dword ptr [ebp-18h], eax
07be2784 90           nop
07be2785 ff75e8       push    dword ptr [ebp-18h] // 두 번째 인자 전달
07be2788 ff75ec       push    dword ptr [ebp-14h] // 첫 번째 인자 전달
07be278b 8b45e4       mov     eax, dword ptr [ebp-1Ch] // _cpuIdFunc 함수 주소
07be278e ffd0         call    eax
07be2790 83c408       add     esp, 8
07be2793 90           nop
07be2794 90           nop
07be2795 90           nop
07be2796 90           nop
07be2797 e8b4141d58   call    coreclr!JIT_PollGC (5fdb3c50)
07be279c 8d65fc       lea     esp, [ebp-4]
07be279f 5f           pop     edi
07be27a0 5d           pop     ebp
07be27a1 c3           ret
그래도 역시 어렵지 않죠? ^^ 저 위치의 call 명령어는 우리가 C#에서 바이트 코드로 만든 _cpuIdFunc를 호출합니다. 그리고 call 위치에서 각각의 값을 확인해 보면,
0:000> ? dwo(ebp-18h)
Evaluate expression: -2147483648 = 80000000

0:000> ? dwo(ebp-14h)
Evaluate expression: 76855328 = 0494b820

0:000> ? @eax
Evaluate expression: 137232384 = 082e0000
보는 바와 같이 정상적으로 cdecl 호출 규약에 맞게 인자를 스택에 쌓은 다음 call을 호출했습니다. 즉, CLR Jitter가 생성한 코드는 아무런 오류도 없었던 것입니다.
그러고 보니, 이렇게 확인하고 나니까 우리가 Visual C++ disassembly 창으로부터 따온 바이트 코드의 이상한 점이 눈에 보입니다.
082e0000 8b450c mov     eax, dword ptr [ebp+0Ch]
082e0003 33c9   xor     ecx, ecx
082e0005 53     push    ebx
082e0006 56     push    esi
082e0007 57     push    edi
082e0008 53     push    ebx
082e0009 0fa2   cpuid
082e000b 8bfb   mov     edi, ebx
082e000d 5b     pop     ebx
082e000e 8b7508 mov     esi, dword ptr [ebp+8]
082e0011 8906   mov     dword ptr [esi], eax
082e0013 897e04 mov     dword ptr [esi+4], edi
082e0016 894e08 mov     dword ptr [esi+8], ecx
082e0019 5f     pop     edi
082e001a 89560c mov     dword ptr [esi+0Ch], edx
082e001d 5e     pop     esi
082e001e 5b     pop     ebx
082e001f 5d     pop     ebp
082e0020 c3     ret
즉, 자신의 스택 프레임을 구성하지 않고 멋대로 ebp를 기준으로 함수의 인자를 접근하고 있습니다. 도대체 이유가 뭘까요? ^^; 처음에는 저게 Visual C++의 최적화 때문이라고 생각했는데요, 답은 의외의 곳에서 나왔습니다.
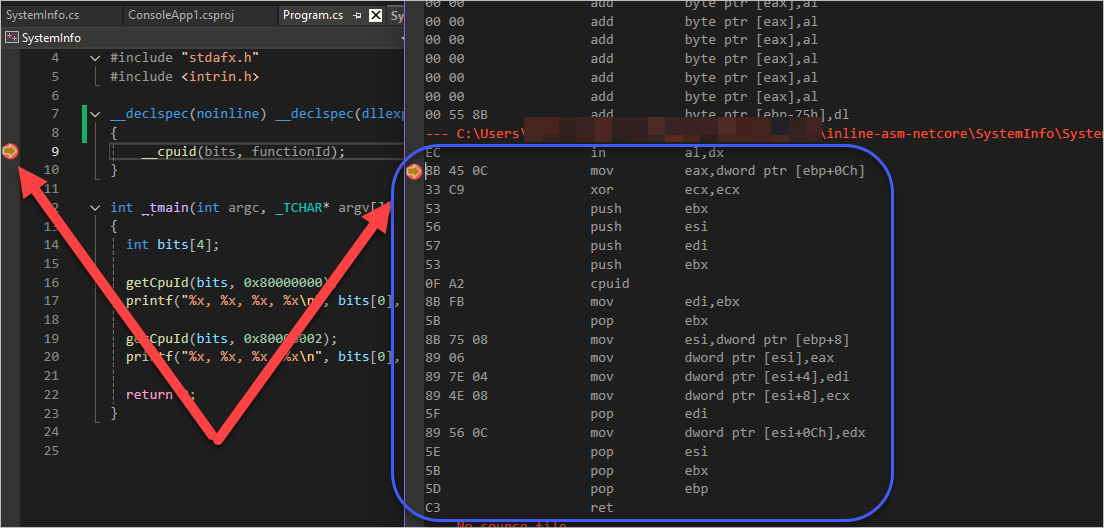
바로 BP의 문제였는데요, 아래 화면은 BP를 __cpuid 라인에 잡고 실행했을 때의 disassembly 창이고,
[그림 1: __cpuid 라인에서 BP 잡았을 때 정상적이지 않은 disassemble 결과]
아래는 BP를 함수 시작 위치에 잡고 실행했을 때의 disassembly 창입니다.
[그림 2: 함수의 시작 블록에서 BP 잡았을 때 정상적인 disassemble 결과]
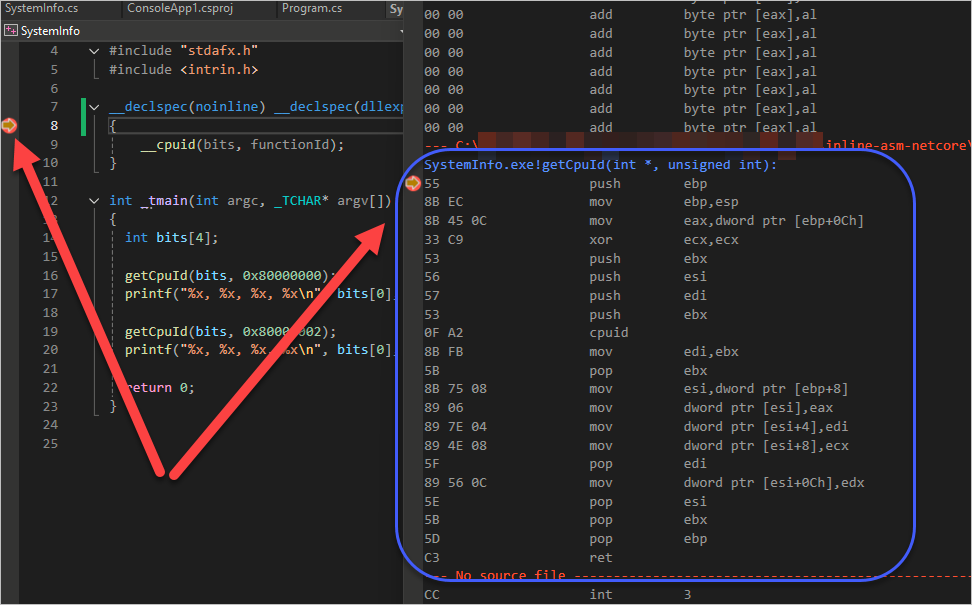
그렇습니다. 이 글의 처음에서 무시했던 "in al, dx" 명령어가 괜히 있는 게 아니었고,
뭔가 disassemble을 잘못하고 있다는 신호였던 것입니다.
결국, 이렇게 해서 원인을 알았으니 정상적인 스택 프레임 구성을 갖는 코드로 보완하면,
private readonly static byte[] x86CdeclCpuIdBytes =
{
    0x55,           // push        ebp
    0x8B, 0xEC,     // mov         ebp,esp

    0x8B, 0x45, 0x0C,    // mov    eax,dword ptr [ebp+0Ch]
    0x33, 0xC9,          // xor    ecx,ecx
    0x53,                // push   ebx
    0x56,                // push   esi
    0x57,                // push   edi
    0x53,                // push   ebx
    0x0F, 0xA2,          // cpuid
    0x8B, 0xFB,          // mov    edi,ebx
    0x5B,                // pop    ebx
    0x8B, 0x75, 0x08,    // mov    esi,dword ptr [ebp+8]
    0x89, 0x06,          // mov    dword ptr [esi],eax
    0x89, 0x7E, 0x04,    // mov    dword ptr [esi+4],edi
    0x89, 0x4E, 0x08,    // mov    dword ptr [esi+8],ecx
    0x5F,                // pop    edi
    0x89, 0x56, 0x0C,    // mov    dword ptr [esi+0Ch],edx
    0x5E,                // pop    esi
    0x5B,                // pop    ebx
    0x5D,                // pop    ebp
    0xC3,                // ret
};
이후 예제 코드가 올바른 출력을 얻게 됩니다.
namespace ConsoleApplication1;

partial class Program
{
    static void Main(string[] args)
    {
        using (SystemInfo sysInfo = new SystemInfo())
        {
            byte[] cpuIdBytes = new byte[4 * 4];
            sysInfo.GetCpuId(cpuIdBytes, 0x80000000);
            Console.WriteLine(BitConverter.ToString(cpuIdBytes));

            sysInfo.GetCpuId(cpuIdBytes, 0x80000002);
            Console.WriteLine(BitConverter.ToString(cpuIdBytes));
        }
    }
}

/* 출력 결과:
08-00-00-80-00-00-00-00-00-00-00-00-00-00-00-00
31-32-74-68-20-47-65-6E-20-49-6E-74-65-6C-28-52
*/
(
첨부 파일은 이 글의 예제 코드를 포함합니다.)
이번 글을 쓰면서 또 하나 알게 된 사실이 있는데요, __declspec(dllexport) 지시자의 유무에 따라 Visual C++가 생성하는 함수의 호출 규약이 다르다는 점이 있습니다.
예를 들어, 다음과 같이 dllexport 지시자를 제거하면,
// __declspec(noinline) __declspec(dllexport) void __cdecl getCpuId(int bits[], unsigned int functionId)

__declspec(noinline) void __cdecl getCpuId(int bits[], unsigned int functionId)
{
    __cpuid(bits, functionId);
}

/* x86 + Release disassembly
53                   push        ebx
56                   push        esi
57                   push        edi
8B F9                mov         edi,ecx
8B C2                mov         eax,edx
33 C9                xor         ecx,ecx
53                   push        ebx
0F A2                cpuid
8B F3                mov         esi,ebx
5B                   pop         ebx
89 07                mov         dword ptr [edi],eax
89 77 04             mov         dword ptr [edi+4],esi
89 4F 08             mov         dword ptr [edi+8],ecx
89 57 0C             mov         dword ptr [edi+0Ch],edx
5F                   pop         edi
5E                   pop         esi
5B                   pop         ebx
C3                   ret
*/
__cdecl을 명시했는데도 생성된 코드는 fastcall 호출 규약을 따르는 것으로 추측이 됩니다. 물론, dllexport 지시자를 추가하면 다시 __cdecl 호출 규약을 따르는 코드로 생성됩니다. 즉, dllexport 지시자 없이는 __stdcall, __cdecl을 명시해도 한결같이 __fastcall 호출 규약을 따릅니다.
이게 좀 이상한 것이, 프로젝트의 Release 모드의 컴파일 옵션은 이렇게 돼 있는데,
/Yu"stdafx.h" /ifcOutput "Release\" /GS /GL /analyze- /W3 /Gy /Zc:wchar_t /Zi /Gm- /O2 /Ob0 /Fd"Release\vc143.pdb" /Zc:inline /fp:precise /D "WIN32" /D "NDEBUG" /D "_CONSOLE" /D "_UNICODE" /D "UNICODE" /errorReport:prompt /WX- /Zc:forScope /Gd /Oy- /Oi /MD /FC /Fa"Release\" /EHsc /nologo /Fo"Release\" /Fp"Release\SystemInfo.pch" /diagnostics:column
이 중에서
/Gd 옵션의 효과로 __cdecl이 기본값입니다. 즉, /Gd 대신 /Gr 옵션을 설정해야만 __fastcall을 기본 호출 규약으로 사용하는 것이고, 그나마도 __cdecl, __stdcall을 지정하면 그것에 따라 바뀌어야 하는데도 문서와 다르게 결과가 나온 것입니다.
아마도 이것은 __declspec(noinline)과의 연계에서 발생하는 부작용인 듯한데요, 테스트를 위해 noinline 지시자를 없애면 함수 구성이 안 되므로 확인이 불가능합니다. ^^;
혹시 이와 관련된 정보를 아시는 분이 계시다면 덧글 부탁드리겠습니다. ^^
[이 글에 대해서 여러분들과 의견을 공유하고 싶습니다. 틀리거나 미흡한 부분 또는 의문 사항이 있으시면 언제든 댓글 남겨주십시오.]