Microsoft MVP성태의 닷넷 이야기
글쓴 사람
정성태 (techsharer at outlook.com)
홈페이지
첨부 파일
 
(연관된 글이 1개 있습니다.)

Visual Studio Code에서 콘솔 응용 프로그램 개발 시 "입력"받는 방법

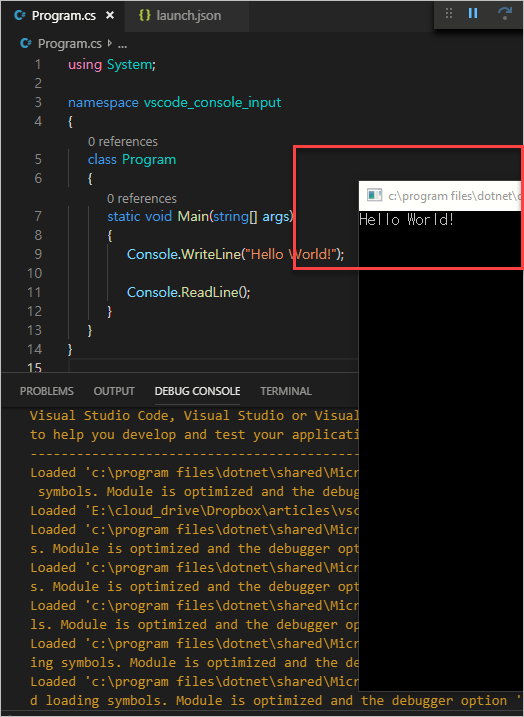
예를 들어 다음과 같이 입력을 받는 콘솔 프로그램을 만든 경우,

using System;

class Program
{
    static void Main(string[] args)
    {
        Console.WriteLine("Hello World!");

        Console.ReadLine();
    }
}

Visual Studio Code에서 실행하면 "입력"을 받을 수 없습니다. 물론 필요가 없다면 그냥 종료해도 되겠지만 그렇지 않은 경우라면 문제가 되는데요, 이에 대해서는 관련 옵션을 설정할 수 있는 다음의 공식 문서에 해답이 있습니다.

Configuring launch.json for C# debugging - Console (terminal) window
; https://github.com/OmniSharp/omnisharp-vscode/blob/master/debugger-launchjson.md#console-terminal-window

Debug Console window cannot accept Console.ReadLine() input during debugging
; https://github.com/OmniSharp/omnisharp-vscode/issues/1053

그러니까, ".vscode/launch.json" 파일을 보면 기본적으로 "console" 설정이 입력을 받을 수 없는 "internalConsole"로 되어 있습니다.

{
   // Use IntelliSense to find out which attributes exist for C# debugging
   // Use hover for the description of the existing attributes
   // For further information visit https://github.com/OmniSharp/omnisharp-vscode/blob/master/debugger-launchjson.md
   "version": "0.2.0",
   "configurations": [
        {
            "name": ".NET Core Launch (console)",
            "type": "coreclr",
            "request": "launch",
            "preLaunchTask": "build",
            // If you have changed target frameworks, make sure to update the program path.
            "program": "${workspaceFolder}/bin/Debug/netcoreapp3.0/vscode_console_input.dll",
            "args": [],
            "cwd": "${workspaceFolder}",
            // For more information about the 'console' field, see https://aka.ms/VSCode-CS-LaunchJson-Console
            "console": "internalConsole",
            "stopAtEntry": false
        },
        {
            "name": ".NET Core Attach",
            "type": "coreclr",
            "request": "attach",
            "processId": "${command:pickProcess}"
        }
    ]
}

이 값을 "integratedTerminal" 또는 "externalTerminal"로 바꿔주면 입력 값을 받을 수 있는데요. "externalTerminal"의 경우 실행 시 Visual Studio Code의 하단 "OUTPUT" 뷰가 사용되지 않고 아예 콘솔 창이 하나 뜨게 됩니다.

vscode_console_input_1.png

새 창이 하나 뜨는 게 왠지 거슬릴 수 있는데, 그런 경우라면 "integratedTerminal" 옵션을 선택하면 됩니다.


참고로 "Remote Development" 환경의 경우,

로컬의 Visual Studio Code로 원격 리눅스 머신에 접속해 개발하는 방법
; https://www.sysnet.pe.kr/2/0/11942

윈도우에서 리눅스로 접근하고 있다면, "externalTerminal" 설정은 다음과 같은 식의 오류가 발생하게 됩니다.

Unable to launch debugger worker process (vsdbg) through the terminal. can't find terminal application 'xterm'

xterm을 설치해 주면,

[Centos 7]

$sudo yum install xterm

이제는 다음과 같이 바뀝니다.

Unable to launch debugger worker process (vsdbg) through the terminal. xterm: Xt error: Can't open display: 

저도 해보진 않았는데 아마도 필요한 설정을 해주면,

Windows 10에서 리눅스용 프로그램 설치하고 실행하기
; https://medium.com/rkttu/windows-10%EC%97%90%EC%84%9C-%EB%A6%AC%EB%88%85%EC%8A%A4%EC%9A%A9-%ED%94%84%EB%A1%9C%EA%B7%B8%EB%9E%A8-%EC%84%A4%EC%B9%98%ED%95%98%EA%B3%A0-%EC%8B%A4%ED%96%89%ED%95%98%EA%B8%B0-2cb0d7892d12

Xming X Server for Windows
; http://sourceforge.net/projects/xming/

"externalTerminal" 설정이 동작해 새 창으로 뜨게 될 것입니다. 하지만, "integratedTerminal" 옵션이 제공되므로 저렇게까지 할 필요는 없는 것 같습니다. "integratedTerminal" 옵션이 한 가지 불편한 점이 있다면, 그 모드로 띄웠을 때 예외가 발생해 콘솔 프로그램이 종료되면 "OUTPUT" 창이 더 이상 동작하지 않게 되는 문제가 발생한다는 점입니다. 이럴 때는 OUTPUT 창을 닫고 다시 열어야 하는 식으로 조정을 좀 해야 합니다.


[이 글에 대해서 여러분들과 의견을 공유하고 싶습니다. 틀리거나 미흡한 부분 또는 의문 사항이 있으시면 언제든 댓글 남겨주십시오.]

[연관 글]


[최초 등록일: ]
[최종 수정일: 7/5/2019]

Creative Commons License
이 저작물은 크리에이티브 커먼즈 코리아 저작자표시-비영리-변경금지 2.0 대한민국 라이센스에 따라 이용하실 수 있습니다.
by SeongTae Jeong, mailto:techsharer at outlook.com

비밀번호

댓글 작성자


... [76]  77  78  79  80  81  82  83  84  85  86  87  88  89  90  ...
NoWriterDateCnt.TitleFile(s)
12074정성태12/10/201921442디버깅 기술: 140. windbg/Visual Studio - 값이 변경된 경우를 위한 정지점(BP) 설정(Data Breakpoint)
12073정성태12/10/201922104Linux: 24. Linux/C# - 실행 파일이 아닌 스크립트 형식의 명령어를 Process.Start로 실행하는 방법
12072정성태12/9/201918802오류 유형: 583. iisreset 수행 시 "No such interface supported" 오류
12071정성태12/9/201923047오류 유형: 582. 리눅스 디스크 공간 부족 및 safemode 부팅 방법
12070정성태12/9/201924606오류 유형: 581. resize2fs: Bad magic number in super-block while trying to open /dev/.../root
12069정성태12/2/201921512디버깅 기술: 139. windbg - x64 덤프 분석 시 메서드의 인자 또는 로컬 변수의 값을 확인하는 방법
12068정성태11/28/201930061디버깅 기술: 138. windbg와 Win32 API로 알아보는 Windows Heap 정보 분석 [3]파일 다운로드2
12067정성태11/27/201921576디버깅 기술: 137. 실제 사례를 통해 Debug Diagnostics 도구가 생성한 닷넷 웹 응용 프로그램의 성능 장애 보고서 설명 [1]파일 다운로드1
12066정성태11/27/201921175디버깅 기술: 136. windbg - C# PInvoke 호출 시 마샬링을 담당하는 함수 분석 - OracleCommand.ExecuteReader에서 OpsSql.Prepare2 PInvoke 호출 분석
12065정성태11/25/201918818디버깅 기술: 135. windbg - C# PInvoke 호출 시 마샬링을 담당하는 함수 분석파일 다운로드1
12064정성태11/25/201922471오류 유형: 580. HTTP Error 500.0/500.33 - ANCM In-Process Handler Load Failure
12063정성태11/21/201921497디버깅 기술: 134. windbg - RtlReportCriticalFailure로부터 parameters 정보 찾는 방법
12062정성태11/21/201920419디버깅 기술: 133. windbg - CoTaskMemFree/FreeCoTaskMem에서 발생한 덤프 분석 사례 - 두 번째 이야기
12061정성태11/20/201920514Windows: 167. CoTaskMemAlloc/CoTaskMemFree과 윈도우 Heap의 관계
12060정성태11/20/201923068디버깅 기술: 132. windbg/Visual Studio - HeapFree x64의 동작 분석
12059정성태11/20/201922289디버깅 기술: 131. windbg/Visual Studio - HeapFree x86의 동작 분석
12058정성태11/19/201922886디버깅 기술: 130. windbg - CoTaskMemFree/FreeCoTaskMem에서 발생한 덤프 분석 사례
12057정성태11/18/201917876오류 유형: 579. Visual Studio - Memory 창에서 유효한 주소 영역임에도 "Unable to evaluate the expression." 오류 출력
12056정성태11/18/201924552개발 환경 구성: 464. "Microsoft Visual Studio Installer Projects" 프로젝트로 EXE 서명 및 MSI 파일 서명 방법파일 다운로드1
12055정성태11/17/201918530개발 환경 구성: 463. Visual Studio의 Ctrl + Alt + M, 1 (Memory 1) 등의 단축키가 동작하지 않는 경우
12054정성태11/15/201920121.NET Framework: 869. C# - 일부러 GC Heap을 깨뜨려 GC 수행 시 비정상 종료시키는 예제
12053정성태11/15/201920983Windows: 166. 윈도우 10 - 명령행 창(cmd.exe) 속성에 (DotumChe, GulimChe, GungsuhChe 등의) 한글 폰트가 없는 경우
12052정성태11/15/201919882오류 유형: 578. Azure - 일정(schedule)에 등록한 runbook이 1년 후 실행이 안 되는 문제(Reason - The key used is expired.)
12051정성태11/14/201924600개발 환경 구성: 462. 시작하자마자 비정상 종료하는 프로세스의 메모리 덤프 - procdump [1]
12050정성태11/14/201921895Windows: 165. AcLayers의 API 후킹과 FaultTolerantHeap
12049정성태11/13/201922277.NET Framework: 868. (닷넷 프로세스를 대상으로) 디버거 방식이 아닌 CLR Profiler를 이용해 procdump.exe 기능 구현
... [76]  77  78  79  80  81  82  83  84  85  86  87  88  89  90  ...